
The quest for better global precipitation data
Information on precipitation is essential for almost any hydrological study. Unfortunately, precipitation is also one of the most difficult to estimate meteorological variables, due its tremendous spatio-temporal heterogeneity, particularly in tropical, mountainous, and snow-dominated regions.
Over the past decades, many precipitation datasets have been developed using different techniques and observation sources (see, for instance, International Precipitation Working Group, UCAR Climate Data Guide, and Reanalyses.org).
So, which precipitation dataset should one use?
Well, that depends on the application, but in the context of global hydrological modelling it has never really been possible to identify the “best” dataset for several reasons.
- Importantly, none of the currently available datasets exploit the complementary nature of satellite and reanalysis data, or fully use all the available gauge data.
- Moreover, many datasets cover only part of the global land surface, and have a short temporal record, or a coarse spatial or temporal resolution.
- Last but not least, the datasets rarely fully account for gauge undercatch and orographic effects, and therefore exhibit biases in snow-dominated and mountainous areas (see, for example, Herold et al., 2015).
The MSWEP dataset
 To address these shortcomings, we recently developed a new global precipitation dataset, with higher spatial and temporal resolution than most available datasets (0.25° and three-hourly, respectively). Referred to as Multi-Source Weighted-Ensemble Precipitation (MSWEP; fully described in Beck et al., 2016), the dataset currently covers the period 1979–2015.
It is unique in that it uses an unprecedented range of data sources, including two datasets based solely on rain gauges (GPCC and CPC Unified), three on satellites (CMORPH, GSMaP, and TMPA), and two on reanalyses (ERA-Interim and JRA-55). The use of rain-gauge data ensures reliable precipitation estimates in regions with dense rain-gauge networks, while satellite and reanalysis data are used to enhance the precipitation estimates in sparsely-sampled tropical and snow-dominated regions.
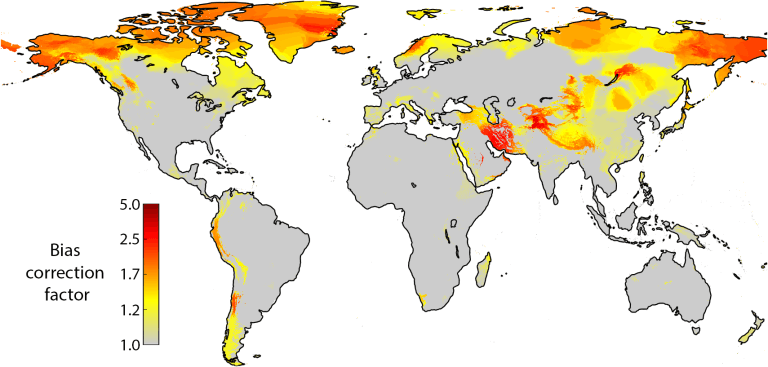
Another useful aspect of MSWEP is that it accounts for gauge undercatch and orographic effects in a new way. Traditionally, equations that incorporate wind speed and air temperature have been used to correct for gauge undercatch, but we did not find these equations to perform well. In Central Russia, for example, precipitation was consistently overestimated, while there was insufficient precipitation in many mountainous regions. Instead, we developed a novel approach to infer the “true” precipitation from streamflow observations for ~14,000 catchments across the globe using a Budyko-type equation, after which we interpolated the resulting bias correction factors to obtain a global bias correction map (see figure below).

Figure 1: Bias correction factors based on streamflow observations.
The video below shows an animation of three-hourly precipitation data from MSWEP for the seven-month period of June to December 2006.

Figure 2: Three-hourly MSWEP precipitation, for the seven-month period from June to December 2006 [Click on the image to see the animation].
The patchy nature of precipitation in the tropics, where MSWEP relies mainly on data from instruments onboard the (now decommissioned) TRMM satellite, is due to the localised convective storms that develop in warm, moist tropical conditions.
By contrast, large frontal systems occur when cold and warm air masses collide in poleward regions, where MSWEP relies primarily on reanalysis datasets produced using atmospheric models, which are designed to simulate large-scale weather systems. Finally, large mountain ranges, for example along the Pacific Coast of North America, show the occurrence of orographic storms due to the uplift of moist air.
| MSWEP is freely available via www.gloh2o.org. For more information, see our open-access publication in HESS Discussions here. |
Applicability of MSWEP
MSWEP is useful for a broad range of hydrological applications from local to global scales.
- The value of MSWEP for streamflow simulation has been assessed by Beck et al. (2016). To this end, we calibrated the popular HBV hydrological model against daily streamflow observations with different precipitation estimates, including MSWEP. The calibration was performed for 9,172 catchments across the globe.

Figure 3: Median NSE scores obtained after calibration of HBV using different precipitation datasets. Catchments are grouped on the y-axis according to mean distance to the closest rain gauge.
The figure on the right presents median Nash-Sutcliffe Efficiency (NSE) scores obtained after calibration for catchments grouped according to their mean distance to the closest rain gauge. MSWEP (dark blue) obtained higher scores for all groups, suggesting that MSWEP performs well in regions with dense as well as sparse rain-gauge networks.
The results for catchments with a mean distance of more than 25 km to the closest rain gauge are of particular interest, since ~84% of the global land surface falls into those categories!
- The value of MSWEP for evaporation and soil moisture simulation was also assessed. For this purpose we used the Global Land Evaporation Amsterdam Model (GLEAM), a relatively simple, observation-driven model designed to estimate terrestrial evaporation from satellite-based inputs.
For 64 FLUXNET tower stations around the globe, the GLEAM-based evaporation and soil moisture simulations obtained using precipitation from MSWEP and CPC Unified (which is based on rain-gauge data) were validated against observations. MSWEP was found to perform at least as well as CPC Unified, even though FLUXNET tower stations are concentrated in regions with dense rain-gauge networks, where the quality of CPC Unified is known to be very high.
Based on these results, and on the perceived higher quality of MSWEP in sparsely-gauged regions, MSWEP has been selected as the core precipitation forcing for the GLEAM v3.0a dataset, a global 0.25° 35-year record of terrestrial evaporation and soil moisture (freely available here). See the paper by Martens et al. (2016) for more details on the GLEAM-derived datasets.
What’s next?
We plan to continue updating the MSWEP estimates to take advantage of new and improved data sources such as ERA5 (the successor of ERA-Interim; see this presentation by Dick Dee from ECMWF), IMERG (the successor of TMPA; more details and near real-time precipitation maps available here), and SM2RAIN (a precipitation product derived from satellite-based surface soil moisture; see Brocca et al., 2014).
We also plan to include ocean areas, to make MSWEP a truly global dataset, and to correct the daily precipitation distribution data calculated using gauges – mainly to reduce the “drizzle effect” (explained in Maraun, 2013).
Finally, we are developing a near real-time (NRT) version of MSWEP. This product, called MSWEP-NRT, would be the first NRT product to provide fully global precipitation estimates with demonstrated good performance in densely gauged areas as well as tropical and polar regions. MSWEP-NRT should be particularly useful to improve the initialization of the model state variables in global or regional forecasting systems, that is, the amount of water stored in the snowpack, the soil, the groundwater, and other water stores. The Global Flood Awareness System (GloFAS), for example, currently uses the 24-h lead time ECMWF forecast from yesterday to initialize the forecast of today, which means that initialization is solely based on weather model data. The use of MSWEP-NRT should improve initialization in densely gauged regions by taking advantage of the rain gauge data, and in tropical regions by taking advantage of the satellite data. That way, better estimates of precipitation will help achieve better streamflow forecasts.
References
- Beck, H.E., A.I.J.M. van Dijk, V. Levizzani, J. Schellekens, D.G. Miralles, B. Martens, A. de Roo: MSWEP: 3-hourly 0.25° global gridded precipitation (1979–2015) by merging gauge, satellite, and reanalysis data, Hydrology and Earth System Sciences Discussions, doi:10.5194/hess-2016–236, 2016.
- Herold, N., Alexander, L. V., Donat, M. G., Contractor, S., Becker, A.: How much does it rain over land? Geophysical Research Letters, 43, 341–348, 2015.
- Maraun, D.: Bias Correction, Quantile Mapping, and Downscaling: Revisiting the Inflation Issue, Journal of Climate 26(6) 2137–2143, 2013.
- Martens, B., D.G. Miralles, H. Lievens, R. van der Schalie, R.A.M. de Jeu, D. Fernández-Prieto, H.E. Beck, W.A. Dorigo, N.E.C. Verhoest: GLEAM v3: satellite-based land evaporation and root-zone soil moisture, Geoscientific Model Development Discussions, doi:10.5194/gmd-2016-162, 2016.
Original article posted on HEPEX website, 16th August 2016 (Link)