
Remote sensing to better represent river geometry in flood forecast models
Floods are among the most frequent and destructive natural disasters. An accurate and reliable flood forecast system which should model runoff generation, runoff concentration, streamflow propagation and floodplain inundation, can provide vital information for land management and emergency response. Within a robust flood forecast system, Hydrological models predict runoff generation and concentration from rainfall forecasts, which is subsequently used in Hydraulic models to compute water level and velocity in the river network, as well as when the storage capacity of the river is exceeded, in the floodplain. Precise predictions of inundation extent, level and arrival time in the floodplain require accurate modelling of river flow dynamics which in turn rely on the quality of the three-dimensional representation of river geometry (that is, river bathymetry).
River bathymetry can be measured using sonar instruments mounted to watercrafts or kayaks but field surveys are time and money consuming. Airborne Green Lidar and optical sensors allow faster data collection however, their feasibility is limited to clear and shallow waters. Consequently, even at the catchment scale, it is not economically and practically feasible to measure along the total length of several streams, especially considering that changing inputs of water, sediment, and vegetation often lead to alterations of river geometry over short time scales.
A new method for assessing river bathymetry proved that effective representation of river geometry for flood forecast can be obtained using satellite imagery and global data complemented by field measurements. Advice on field data collection was provided and the method can be applied to many catchments in Australia and worldwide. The research conducted by our team from Monash University (Dr. Stefania Grimaldi, Dr. Yuan Li, Prof. Jeffrey Walker, and A.Prof. Valentijn Pauwels), using as example a hypothetical flood event in the upper Clarence catchment (New South Wales, Australia) showed that flood forecast skill can be improved by combining information from satellite and numerical models. Specifically, spatially distributed remote sensing (RS)-derived inundation levels acquired at the very early stages of a flood event have the potential to support timely and effective diagnosis of the skill of hydraulic flood forecast models. Therefore, our study sheds light on the role of better representation of river bathymetry for improved flood forecasts.
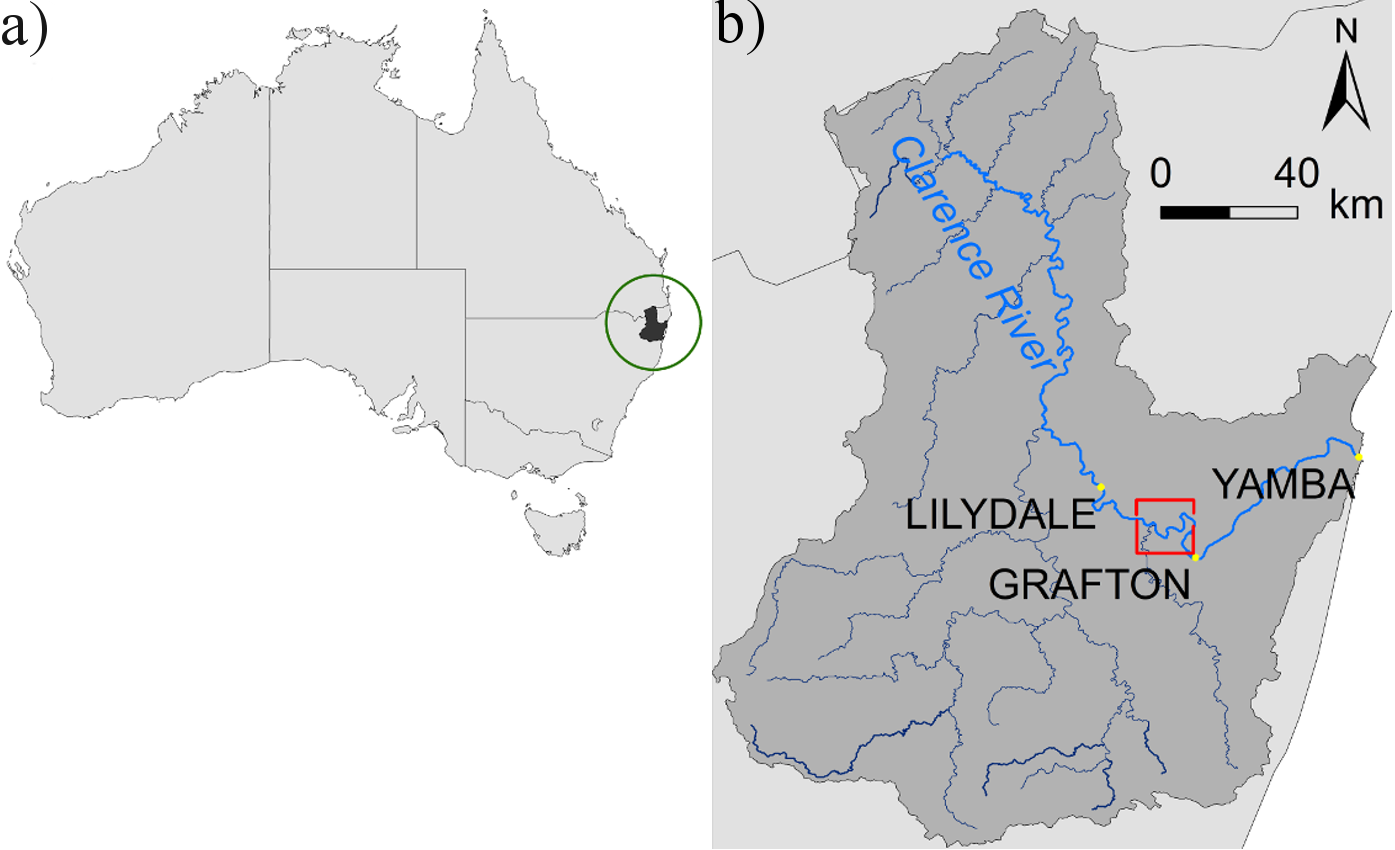
a) Location of the Clarence catchment; b) Clarence catchment, main towns
The paper published in Water Resources Research journal, presents a novel research for the preliminary assessment of river bathymetry in hydraulic flood forecasting models, which is flexible, parsimonious and repeatable over time.
We used the LISFLOOD-FP hydraulic model to simulate a hypothetical flood event. Additionally, a high-resolution model simulation based on accurate bathymetric field data was used to benchmark coarser model simulations based on simplified river geometries. These simplified river geometries were derived from a combination of globally available empirical formulations, remote sensing data, and a limited number of measurements. Model predictive discrepancy between simulations with field data and simplified geometries allowed an assessment of the geometry impact on inundation dynamics. In this study site, the channel geometrical representation for a reliable inundation forecast was achieved using RS-derived river width values combined with a few measurements of river depth sampled at strategic locations.
This numerical experiment showed the potential informative value of comparing patterns of modelled and RS-derived spatially distributed water levels. However in a real case scenario, the impact of uncertainties in RS-derived observations on the use of this data for the diagnosis of errors in model implementation and thus improve floodplain forecasting skill, should be carefully evaluated.
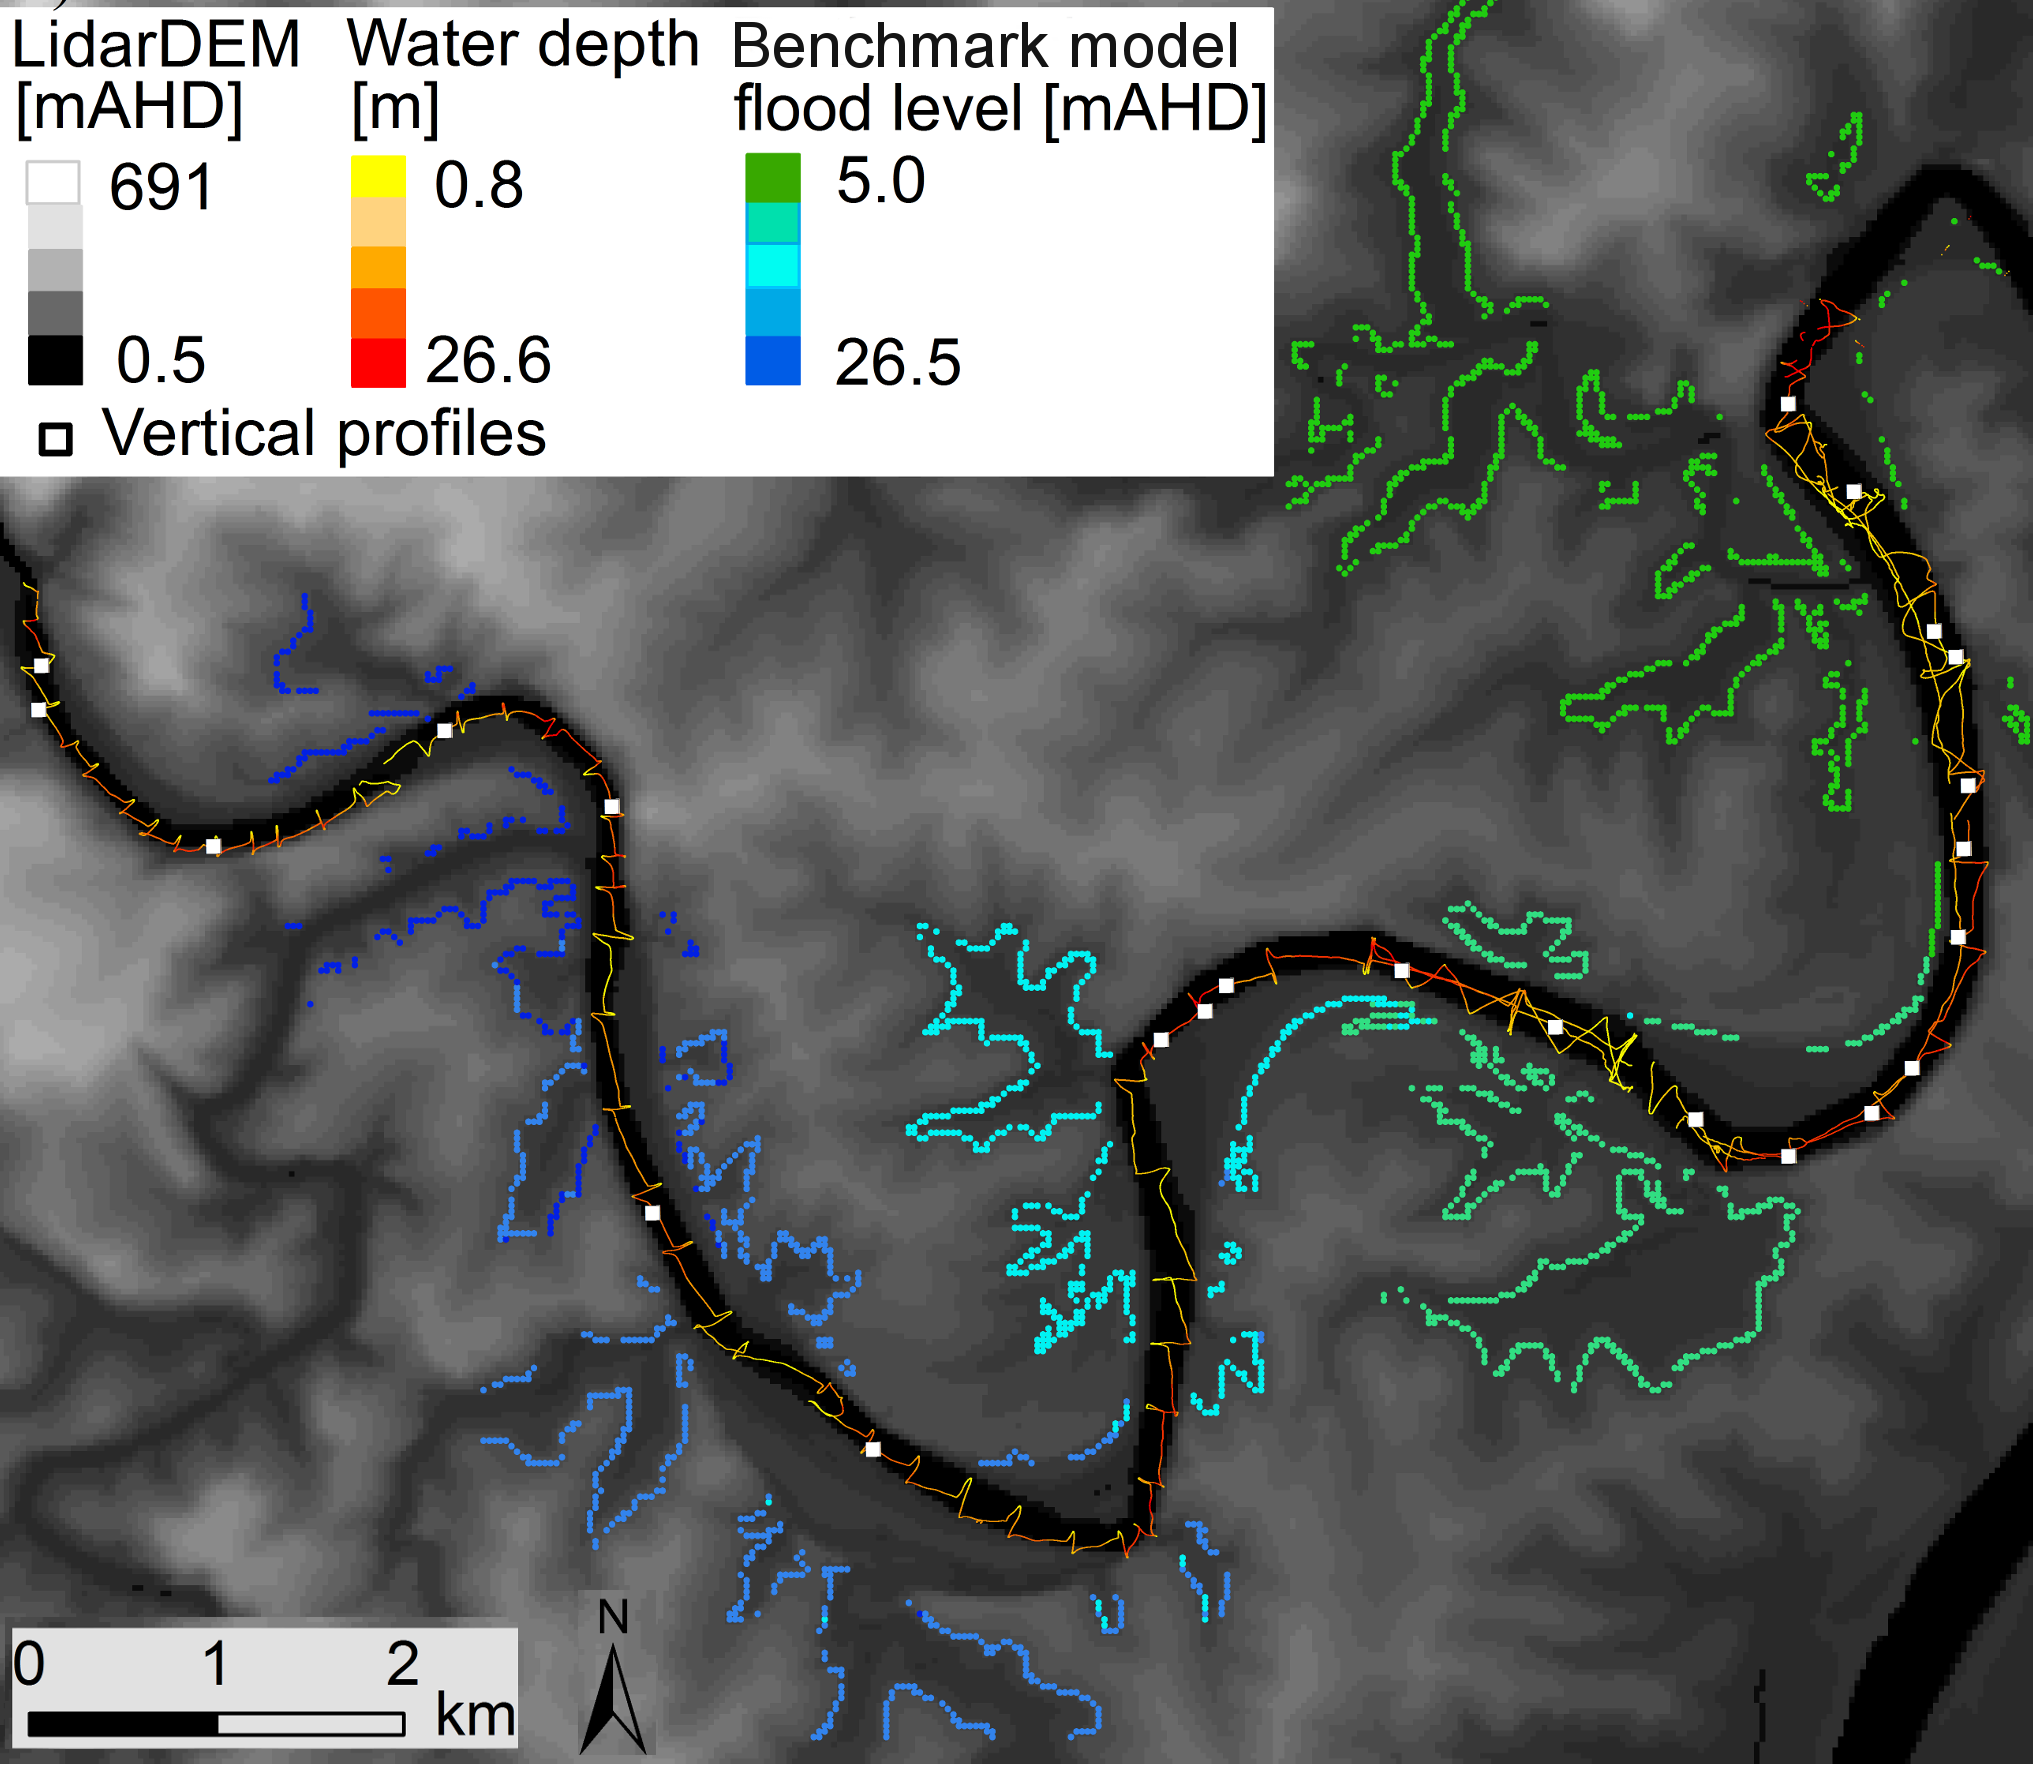
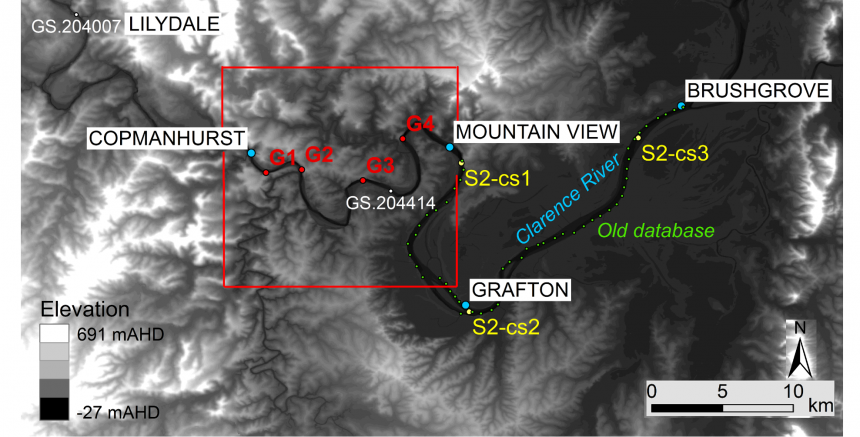
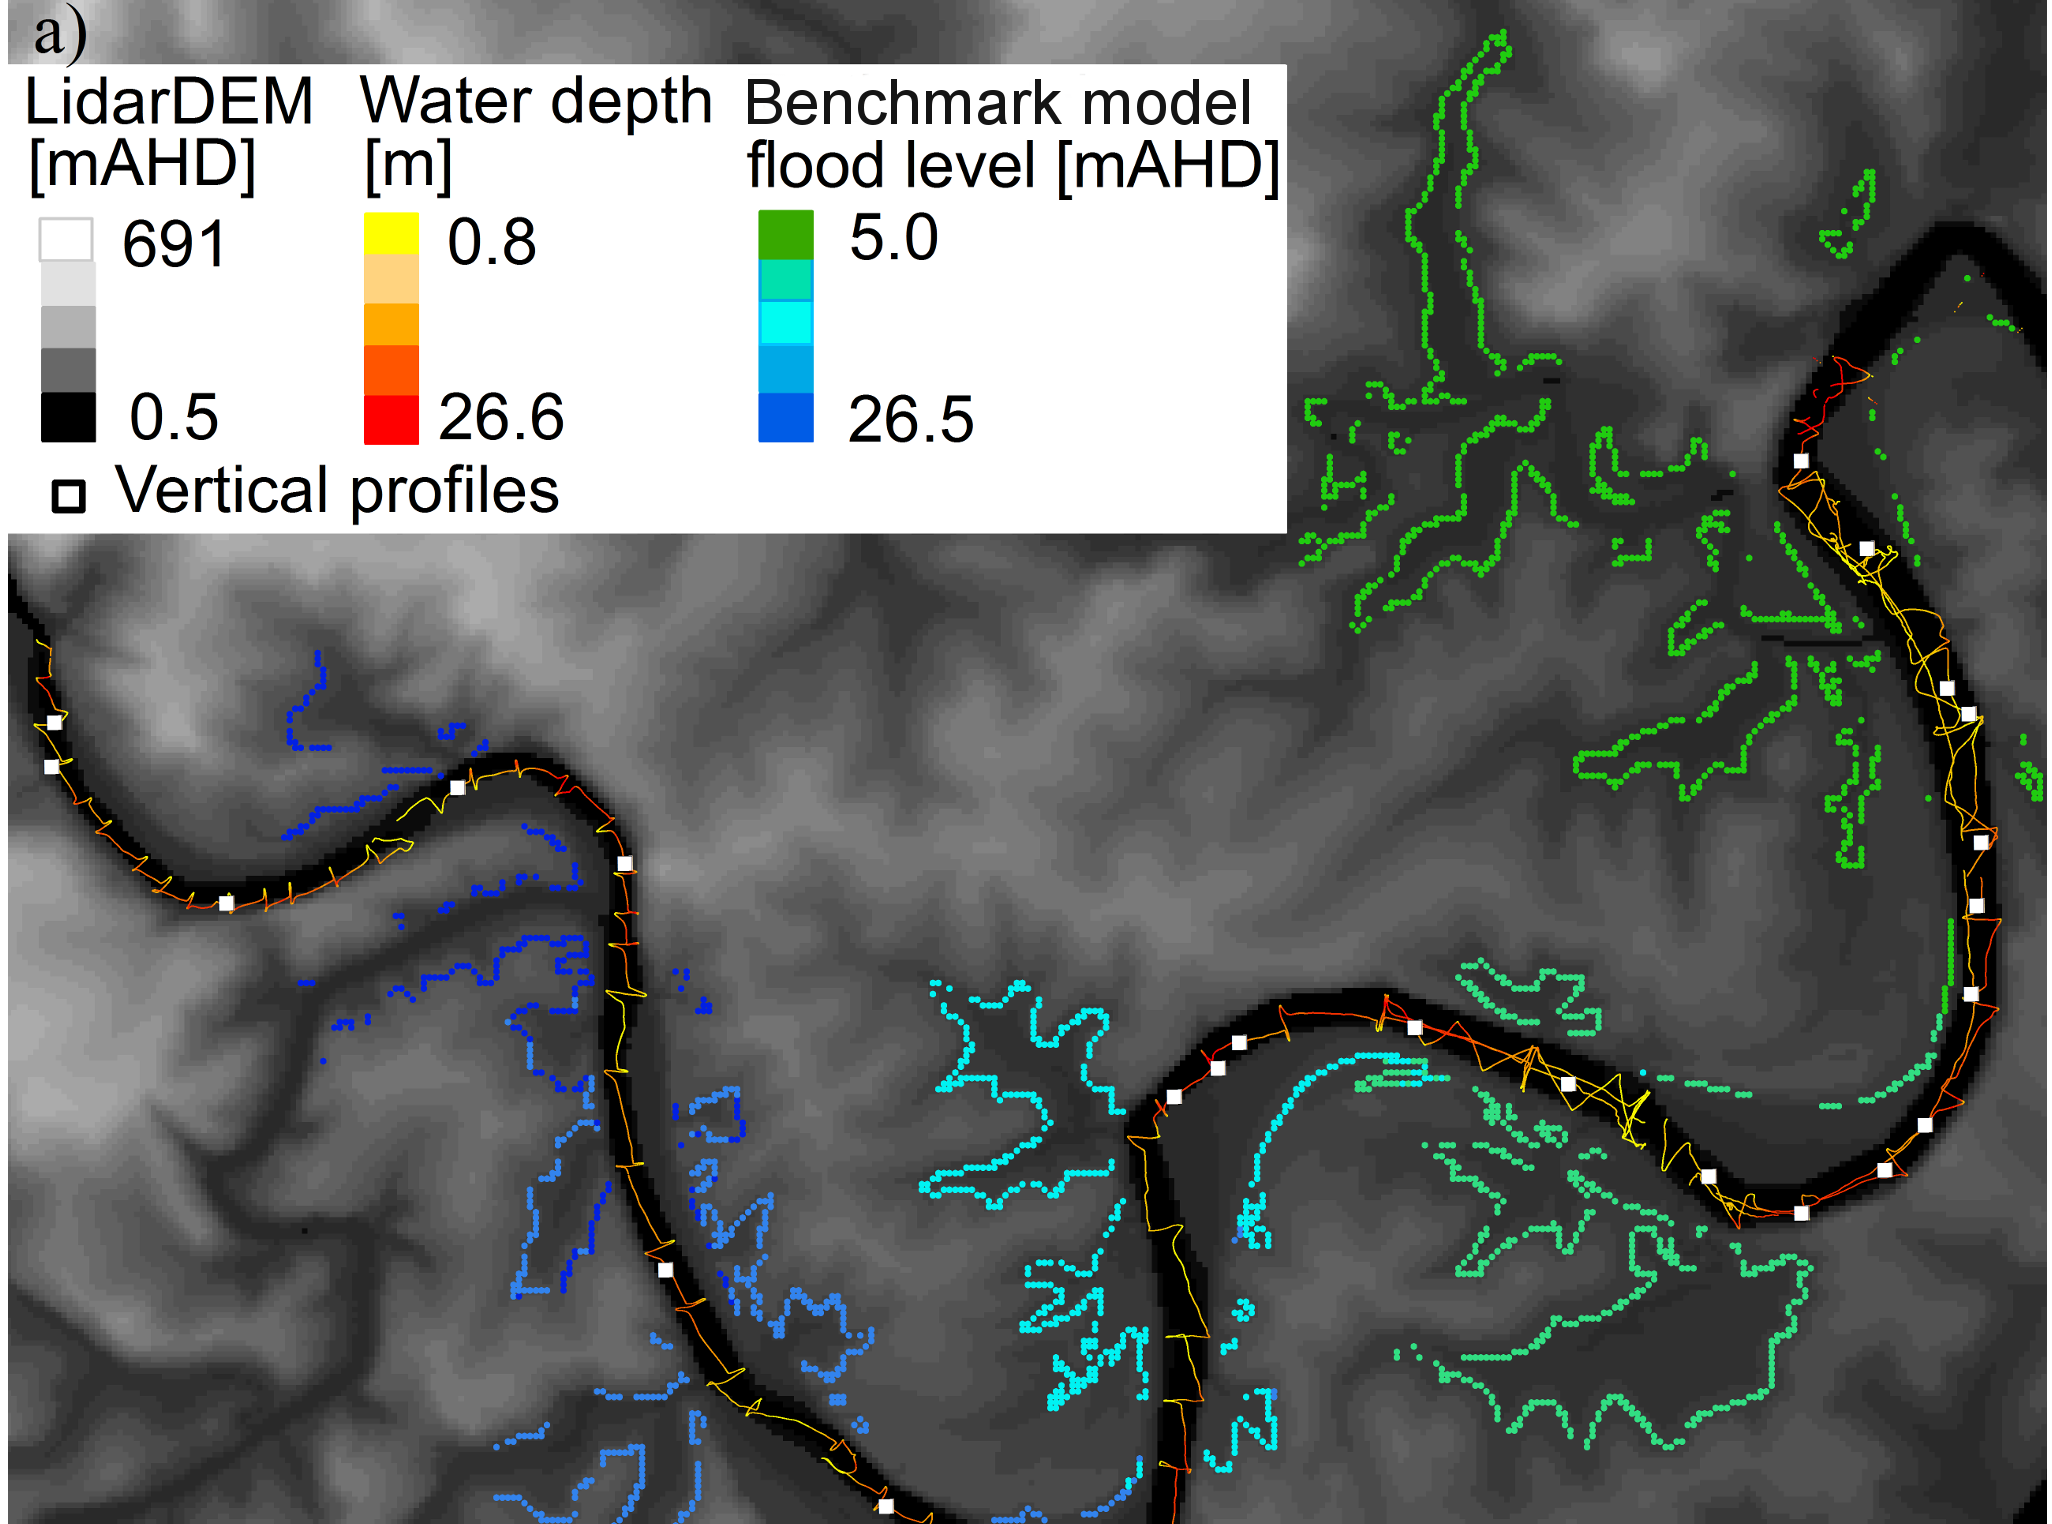
Location and value of the depth measurements; location of the vertical profiles. Hydraulic model results: water levels at flood peak as predicted by the benchmark high-resolution model
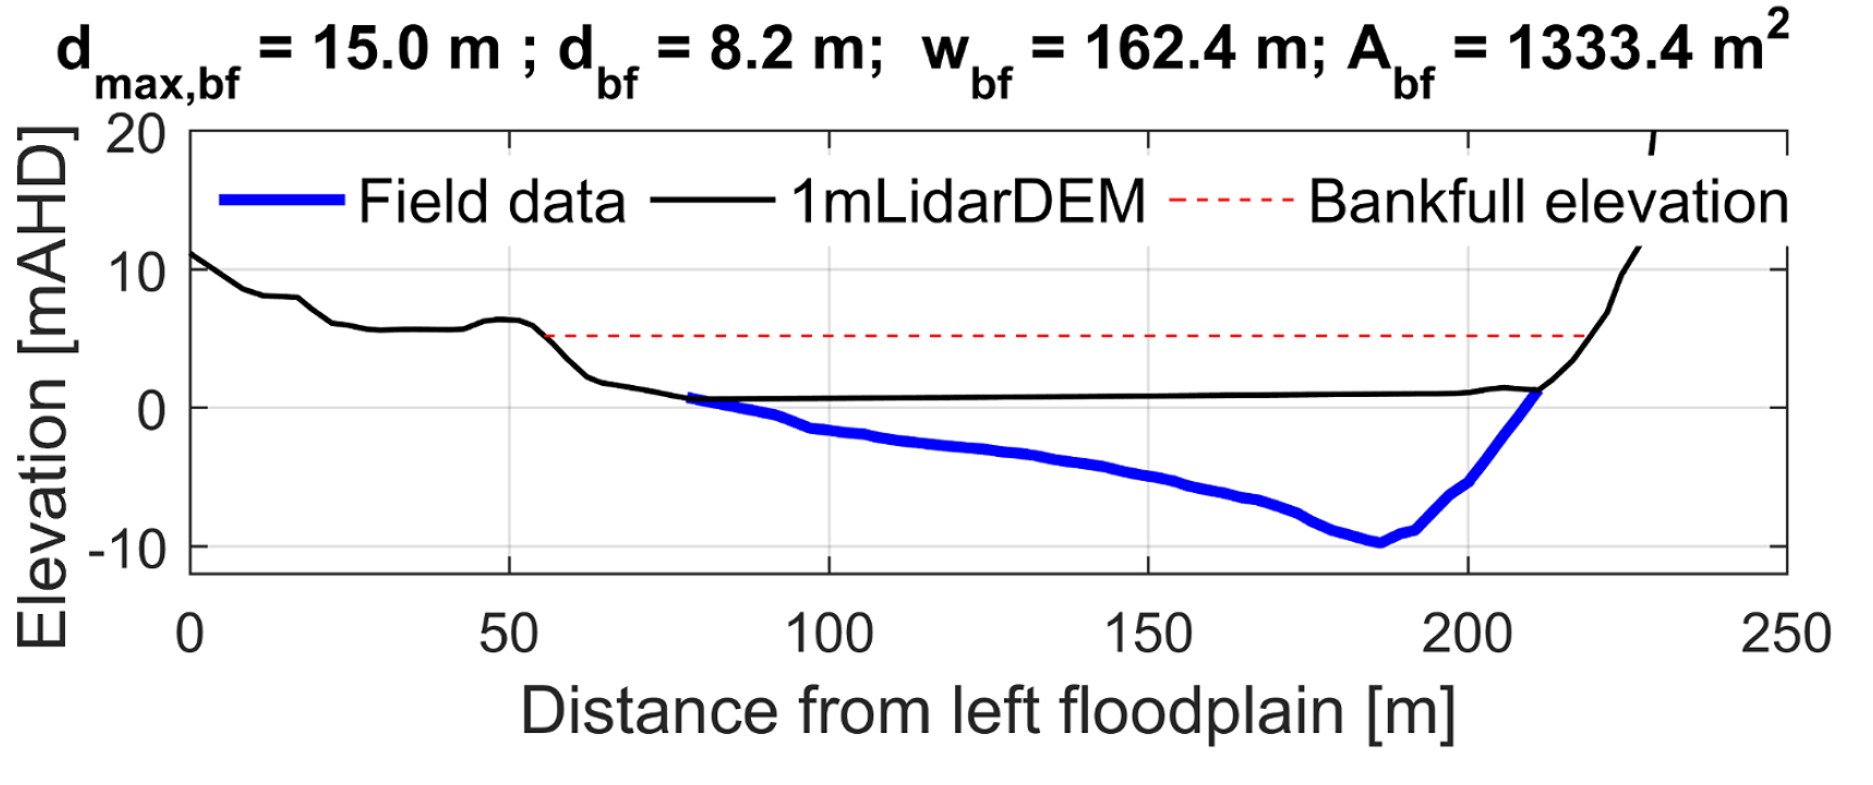
Example of measured vertical profiles of water temperature, salinity, and pressure
Article: ”Effective Representation of River Geometry in Hydraulic Flood Forecast Models”. Grimaldi, S., Li, Y., Walker, J.P., Pauwels, V.R.N., Water Resources Research, 54. https://doi.org/10.1002/2017WR021765