
Taking the pulse of Australia’s environment
Vegetation across Australia received much-needed rains in 2016, but this broad positive trend for the environment was marred by severe ecological damage in some regions. That is the punchline of the recently released ‘Australia’s Environment in 2016’ compiled by researchers of the Water and Landscape Dynamics group at the Australian National University. To produce their annual report, they rely on publicly available environmental information, including several of TERN’s ecosystem data products.
The report, which was released at a briefing in Canberra on 23 February, provides an annual summary of 13 key environmental indicators and how they have changed over time.
Prof Albert van Dijk, who leads the annual report, says ‘the overall story is one of rainfall boom after four years of bust. The national average rainfall in 2016 was again well above average, albeit not quite as much as in the bumper years of 2010-2011.
‘However, we still observed major environmental damage in parts of the country – particularly in Tasmania, which was scorched by bushfire, the Gulf Coast and Cape York, which missed out on the rains’ return and saw large-scale dieback of mangroves, and on the Great Barrier Reef, which suffered massive coral bleaching.’
Dr David Summers, who also contributes to the project, says ‘Of particular value to our analysis are the long time-series of data, such as the satellite-based ecosystem data that is available through TERN AusCover.
‘With much of these data available back until at least the year 2000, we are able to assess longer-term patterns of change in Australia’s environments. Given the well-known ‘boom and bust’ cycle of many Australian ecosystems, this long-term view is critical to understanding our environment.’
The ANU group makes their findings accessible through the Australia’s Environment Explorer, an online platform that anyone can use to visualise and interpret national-scale information on each of the 13 indicators by both region and land cover type. Information can be accessed such as maps, environmental accounts, or graphs, and users can compare across years and also download data for further analysis.
As well as TERN, the project draws upon a range of Australia’s national environmental information and infrastructure platforms provided by the Bureau of Meteorology, Geoscience Australia and CSIRO, with some additional data from NASA and the European Centre for medium-Range Weather Forecasts.
‘We can only deliver our annual report because we can access trusted, national data from a range of sources, and then use the National Computing Infrastructure’s world class infrastructure to integrate and analyse the data,’ Albert says.
- For more information about the ‘Australia’s Environment’ reports, please visit the website, or contact Albert directly.

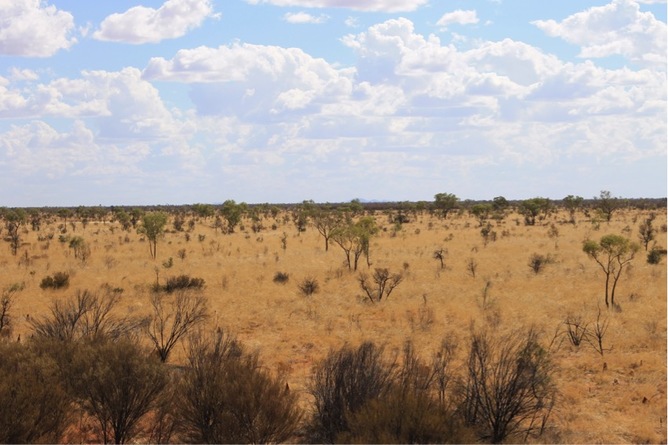
The results of ‘Australia’s Environment in 2016’ are accessible through an online explorer that anyone can use to visualise and interpret national-scale information on each of the 13 indicators, including land cover type (above) and rainfed pasture (below)

Original article published in TERN newsletter March 2017