
Historical extreme rainfall events in southeastern Australia
Most instrumental weather data that we use to study rainfall in Australia only extend back to 1900, which makes it hard to capture the full range of our highly variable climate. In this new study we have used historical rainfall observations in Melbourne, Adelaide and Sydney to add an extra 60 years of information to our climate record.
Using a range of sources we were able to determine monthly rainfall totals, the number of rain days for each month and the wettest day of each month for each city between 1839 and 2017, with only a few gaps. The historical data sources included published summaries in government documents and individual diaries, some spanning 40 years.
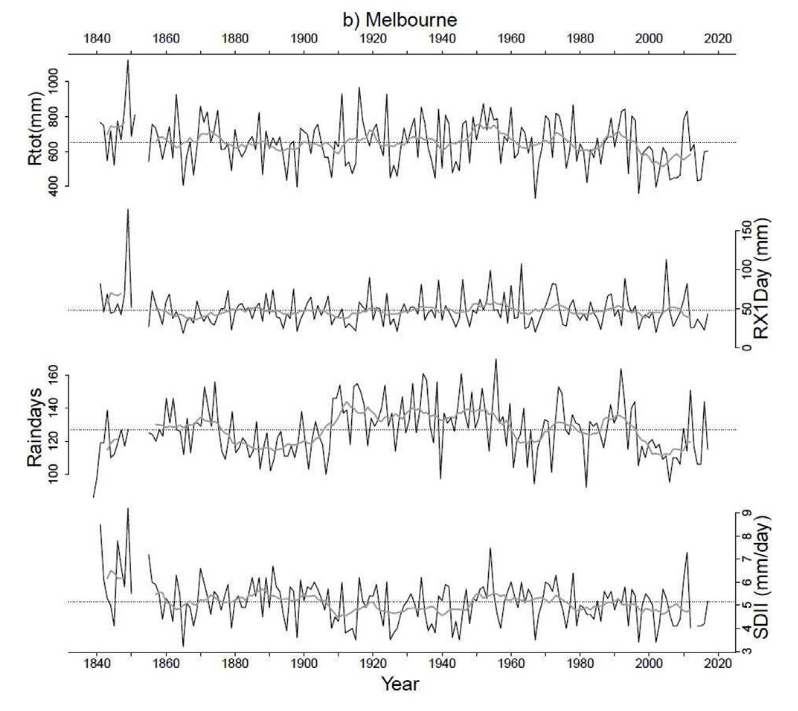
Melbourne’s rainfall, 1839-2017. Rtot = monthly rainfall totals; Rx1day = highest daily rainfall; SDII = Simple Daily Intensity Index. Taken from Ashcroft et al (2019), Figure 3.
Discontinuities between the data sources meant that it was not possible to conduct meaningful trend analysis, but the extended records can still tell us about the long-term variability of rainfall in southeastern Australia. The recent Millennium Drought, for example, stands out in the extended Melbourne record as a clear period of low rainfall due to a drop in the number of rain days.
We also found several extreme daily rainfall events in the mid-1800s in Sydney and Melbourne that warrant further investigation, as they appear to be more extreme than anything in the modern period. The historical data show two events in Sydney in the 1840s where over 500 mm of rain was recorded in a day.
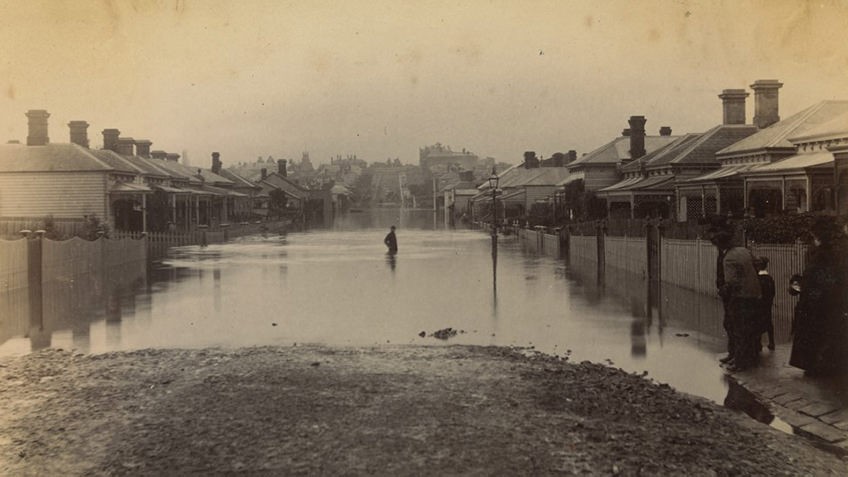
Flooding in Clara St, South Yarra, Melbourne, July 1891. Source: State Library of Victoria.
Finally, we examined the relationship between the extended rainfall records and the El Niño—Southern Oscillation (ENSO). We found that the moderate relationship between ENSO and rainfall totals and rain days in the three cities remained relatively stable over the past 170 years, but that there was no relationship between ENSO and the annual wettest day. This finding is in agreement with other studies that use shorter time series, but provides a new longer-term context to understand the role of Australia’s dominant climate driver.
Paper: Ashcroft, L., Karoly, D.J., Dowdy, A.J. (2019) Historical extreme rainfall events in southeastern Australia. Weather and Climate Extremes 25(2019) 100210. https://doi.org/10.1016/j.wace.2019.100210