
Planning for climate extremes in global farming
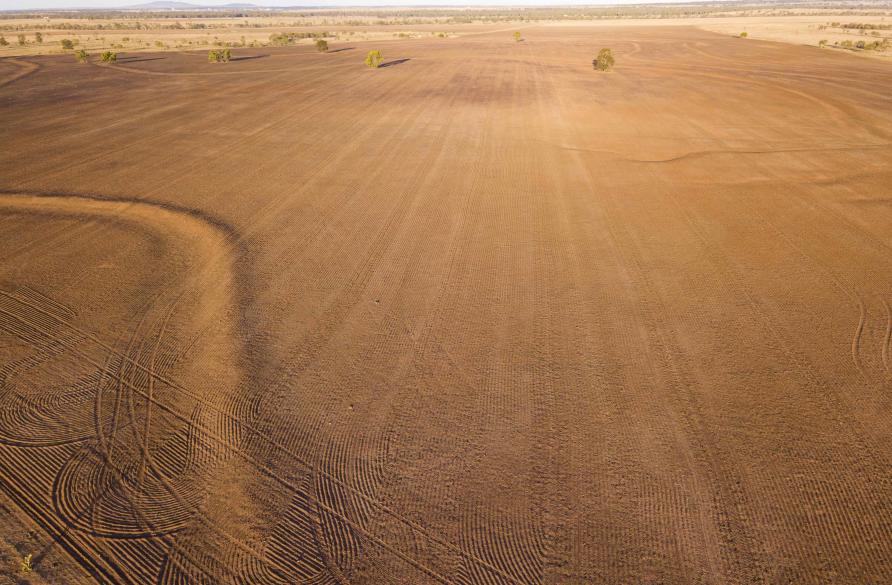
Australia has just experienced its hottest summer on record as well as a succession of climate extremes. Currently, a vast area of New South Wales is drought-affected. Floods have devastated vast sections of Queensland while bushfires and cyclones wreaked havoc across the country.
And bearing the brunt of these extremes are many of Australia’s farmers. In fact, last year’s national farm production was down on 2016 results.
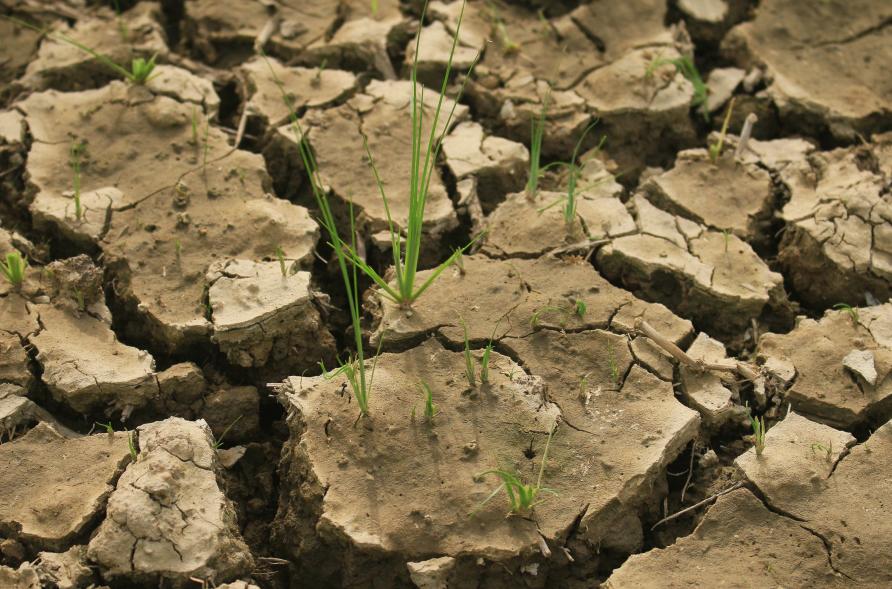
Droughts, heatwaves, cold extremes or floods can all cause severe harvest losses and pose great risks to the livelihoods of farmers, as well as the food security of communities around the world who rely on agriculture.
If we go back to the Millennium Drought in Australia which began in 1997 and ran through until 2009, agricultural production fell from 2.9 per cent to 2.4 per cent of Gross Domestic Product, with drought playing a significant role.
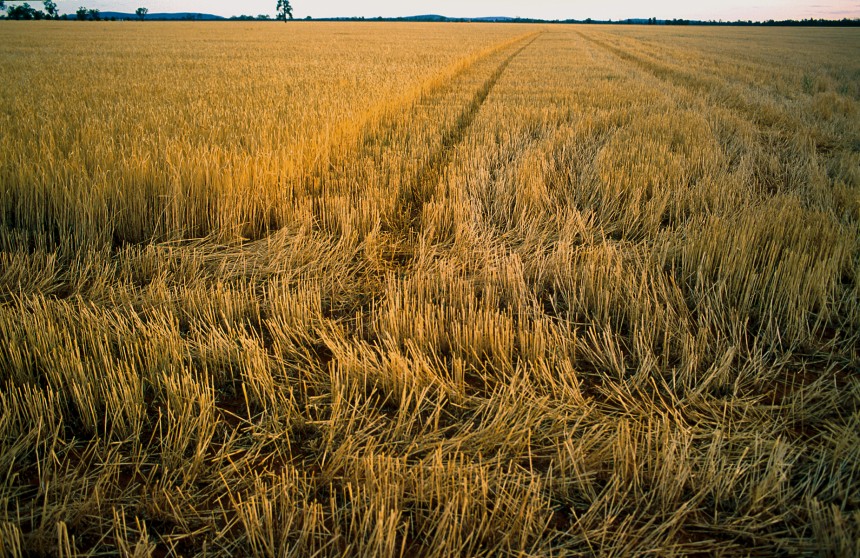
Between 2002 and 2009, rice production in South-East Australia dropped by 99 per cent, while wheat yields declined by 12 per cent compared to pre-drought levels.
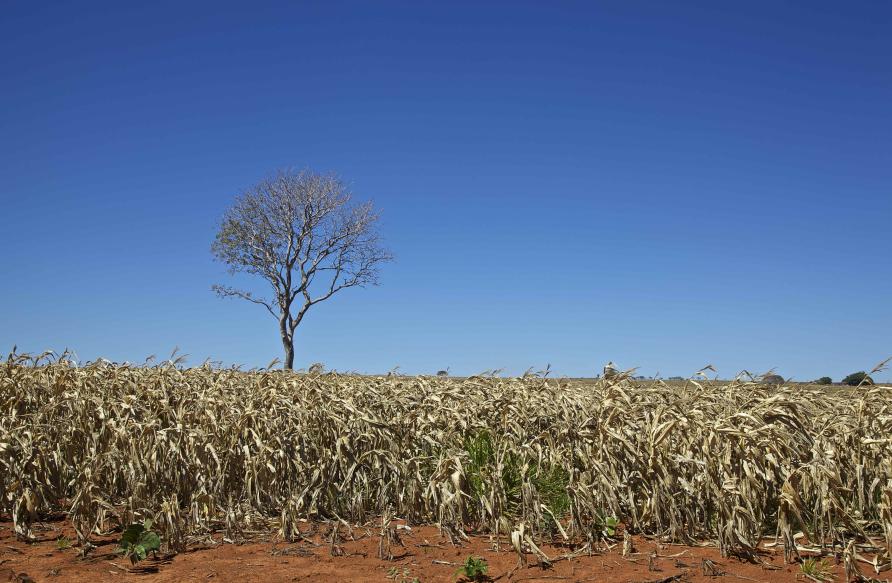
Due to climate change, the frequency and severity of climate extremes is predicted to further increase in most regions worldwide. It means that our global crop yield – the measurement of the amount of agricultural production harvested per unit of land area – will be affected.
It also means that there’s work to be done to plan for, and improve the resilience of our food production systems. But in order to do this, it’s important to understand several things: how climate extremes interact with agricultural yields, to what extent crop yields are influenced by climate extremes and how these interactions differ between agricultural regions.
Crunching the climate numbers
Our new study, published in Environmental Research Letters, investigated the effects of climate conditions on yield during the growing season, using climate and climate extremes datasets with near-global coverage and a high-resolution agricultural database.
This database contains regional crop yield data for the four major crops – maize, rice, soybeans and wheat.
By applying a machine learning algorithm, called Random Forest, we can then investigate the relationship between the year-to-year climate variations and the crop yield fluctuations.
Random Forests is a statistical tool that uses a large number of decision trees (hence the name) that are used to identify patterns in the data and create statistical models. The benefit of Random Forests is that they can capture very complex, non-linear relationships between variables.
Using Random Forests, we looked at the effect of the growing season’s mean climate (that is, temperature and precipitation) and a number of climate extremes indicators (like hot and cold temperature extremes, drought and heavy precipitation events) on yield anomalies.
Overall, changing climate conditions during the growing season explain 20 to 49 per cent of the variance of yield anomalies of all crops we investigated, at the global scale.
This indicates that year-to-year changes in temperature and precipitation, including the growing season mean and extreme events, account for a considerable fraction of year-to-year yield fluctuations.
And these explained variances are especially high for maize: with values between 45 and 55 per cent for all continents, except South America and Oceania.
But how large is the impact of climate extremes?
The effect of climate extremes on crop yields
We compared our results with the outputs of a second statistical model, which only uses the mean growing season temperature and precipitation as predictors for any yield variations. This means we can quantify how much the explained variance drops when climate extremes are excluded from the model.
As a result, we found that climate extremes indicators explain about 18 to 43 per cent of the variance of year-to-year all crop yield anomalies. For maize, soybeans and rice, this represents more than half of the explained variance, emphasising that climate extremes play a very significant role in understanding and predicting yield variations in these crops.
Interestingly, temperature-related variables – both the mean growing season temperature and temperature extremes – play a more significant role in predicting yield fluctuations than precipitation-related variables, such as total growing season precipitation, drought or heavy rain.
It also indicates that a meteorological drought (i.e. below-average rainfall) alone can’t accurately predict yields, but that soil moisture drought – which is affected not only by rainfall, but also other factors, like temperature, solar radiation, water vapour pressure deficit, and the properties of soil and vegetation – could be potentially better predictors of yield anomalies.
Identifying the hotspots
So, what does this all mean for global agricultural production?
We have identified hotspot regions that are critical for global production, as they are contributing a large fraction of the world’s food, but are also particularly susceptible to the effects of climate extremes.
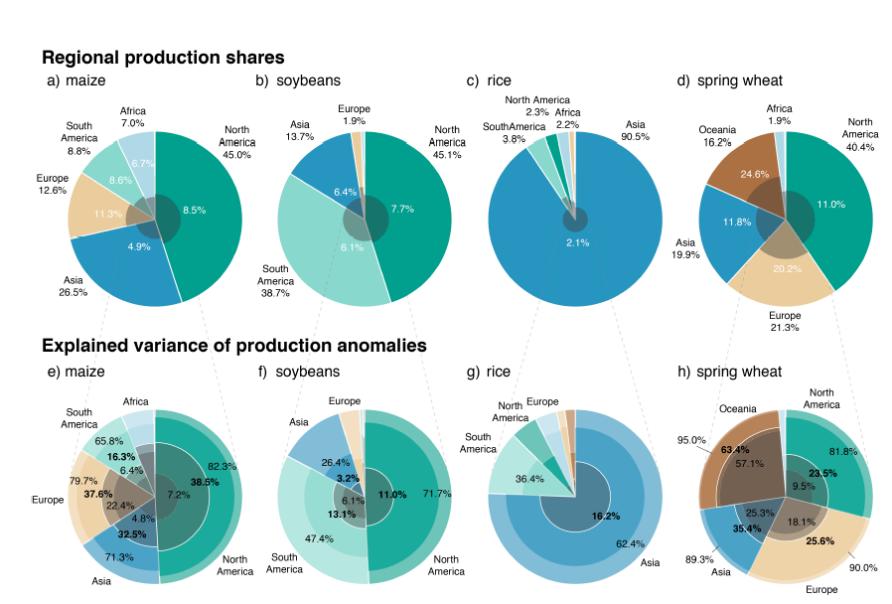
These regions are: North America for maize, spring wheat and soy production, Asia for maize and rice production, and Europe for spring wheat production.
While these hot spot regions are mostly in industrialised, high-input crop producing areas, climate extremes are also critical in other regions, where the contribution to global production might be small, but the reliance of communities on subsistence farming is high.
Overall, our study highlights the importance of considering climate extremes for understanding and predicting the yield we can expect from our crops.
It may be used to support the development and improvement of global and regional seasonal forecasting systems for agriculture – identifying key climate factors and estimating their contribution to yield fluctuations, for each region and crop individually.
This article was first published on Pursuit. Read the original article.