
2014 breaks multiple climate records
The annual State of the Climate report is out, and it’s ugly. Record heat, record sea levels, more hot days and fewer cool nights, surging cyclones, unprecedented pollution, and rapidly diminishing glaciers.
The U.S. National Oceanic and Atmospheric Administration (NOAA) issues a report each year compiling the latest data gathered by 413 scientists from around the world. It’s 288 pages, but we’ll save you some time. Here’s a review, in six charts, of some of the climate highlights from 2014.
1. Temperatures set a new record

Source: NOAA
It’s getting hot out there. Four independent data sets show that last year was the hottest in 135 years of modern record keeping. The map above shows temperature departure from the norm. The eastern half of North America was one of the few cool spots on the planet.
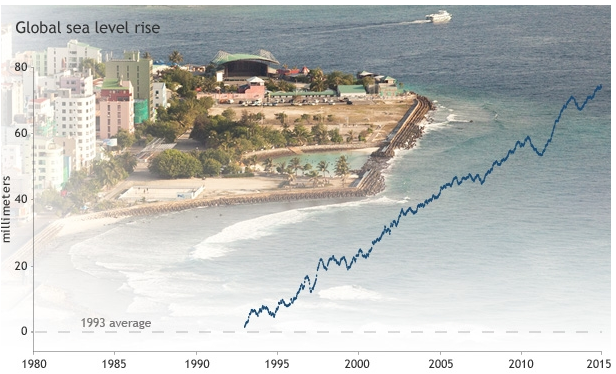
2. Sea levels also surge to a record

Source: NOAA
The global mean sea level continued to rise, keeping pace with a trend of 3.2 millimeters per year over the last two decades. The global satellite record goes back only to 1993, but the trend is clear and consistent. Rising tides are one of the most physically destructive aspects of climate change. Eight of the world’s 10 largest cities are near a coast, and 40 percent of the U.S. population lives in coastal areas, where the risk of flooding and erosion continues to rise.
3. Glaciers retreat for the 31st consecutive year

Source: NOAA
Data from more than three dozen mountain glaciers show that 2014 was the 31st straight year of glacier ice loss worldwide. The consistent retreat of glaciers is considered one of the clearest signals of global warming. Most alarming: The rate of loss is accelerating over time.
4. There are more hot days and fewer cool nights

Source: NOAA
Climate change doesn’t just increase the average temperature—it also increases the extremes. The chart above shows when daily high temperatures max out above the 90th percentile and nightly lows fall below the lowest 10th percentile. The measures were near their global records last year, and the trend is consistently miserable.
5. Record greenhouse gases fill the atmosphere

Source: NOAA
By burning fossil fuels, humans have cranked up concentrations of carbon dioxide in the atmosphere by more than 40 percent since the Industrial Revolution. Carbon dioxide, the most important greenhouse gas, reached a concentration of 400 parts per million for the first time in May 2013. Soon we’ll stop seeing concentrations that low ever again.
The data shown are from the Mauna Loa Observatory in Hawaii. Data collection was started there by C. David Keeling of the Scripps Institution of Oceanography in March 1958. This chart is commonly referred to as the Keeling curve
Original article appeared on Bloomberg Business, 17 July 2015 (link)