
Environmental water storage, extreme climates and hidden droughts

Understanding the impacts of extreme climatic events on environmental water storage is crucial knowledge for Australia, the driest inhabited continent on Earth. Recent work by Zunyi Xie and his colleagues found that Australia gained three times more water during the ‘big wet’ than that lost during the ‘big dry’.
The team used the Gravity Recovery and Climate Experiments (GRACE) twin satellites to investigate the combined impacts of a decade-long drought (2001–09) followed by an intensive rainfall pulse (2010–11) on Australia’s water storage dynamics.
The technique
According to the researchers “previous studies have concentrated on the causes of these extreme events and the impacts on agriculture and ecosystems, treating the ‘big dry’ and ‘big wet’ as discrete periods over the entire continent. This isn’t very realistic given the diversity of Australia’s climate patterns.”
To better understand the timing of changes in total water storage (TWS), the team developed a new method to define a per-pixel transition date between dry and wet periods based on GRACE observations. In doing so the researchers could independently derived information on the ‘big dry’ and ‘big wet’ change-over for each pixel.
Key findings
A key finding of the work was that Australia gained three times more water during the ‘big wet’ than it lost during the ‘big dry’.
“This enormous continental water loading in such a short time was enough to lower sea level and eventually altered the global carbon cycle.” Said UTS PhD candidate and lead author Zunyi Xie.
The researcher also showed the timing of transition between the ‘big dry’ and ‘big wet’ varied significantly across the country, with a difference of 12 months between when the shift occurred in western Australia versus eastern Australia.
Furthermore, the study found that a large part of northern Australia actually gained water during the ‘big dry’. According to the researchers “this is a potential sign of spatial hydrological cycle intensification, with a wetting trend over wetter regions (northern and north-eastern Australia) and a drying trend over drier regions (western Australia)”.
Impacts on Agriculture
An important contribution of this work is that it allows for quantification of the impact of climatic extremes on agricultural production.
“For example, southwestern and southeastern Australia, the two crop-belts, experienced the most dramatic total water storage declines during the ‘big dry’. This resulted in great reductions in crop production over irrigated and dryland agriculture.” Said the researchers.
Moreover, the study also found that the Murray Darling Basin (MDB), the most important basin in Australia for crop production, wetlands, and biodiversity, is highly sensitive to hydroclimatic variations. “The MDB exhibited the most dramatic swings in water loss/gain over the drought and wet periods, especially over the southern part of the basin.” Said the researchers.
Hidden droughts
A significant benefit of using satellite-derived gravity data to measure water storage is that it can measure groundwater stores and detect ‘hidden droughts’. Such events come about when groundwater stores are depleted and this decrease in water availability may not be evident from surface observations. Conversely, the technique can also be used to detect when groundwater stores are shallow, increasing the likelihood of a flood.
Future research directions
This research showed that Australia can be partitioned and grouped into three geographic zones according to their distinct TWS responses to the ‘big dry’ and the ‘big wet’ (figure below). These cluster areas reflect the fundamental influences from the interactions of the three major climate modes (ENSO,IOD and SAM) that affect Australia’s climate.
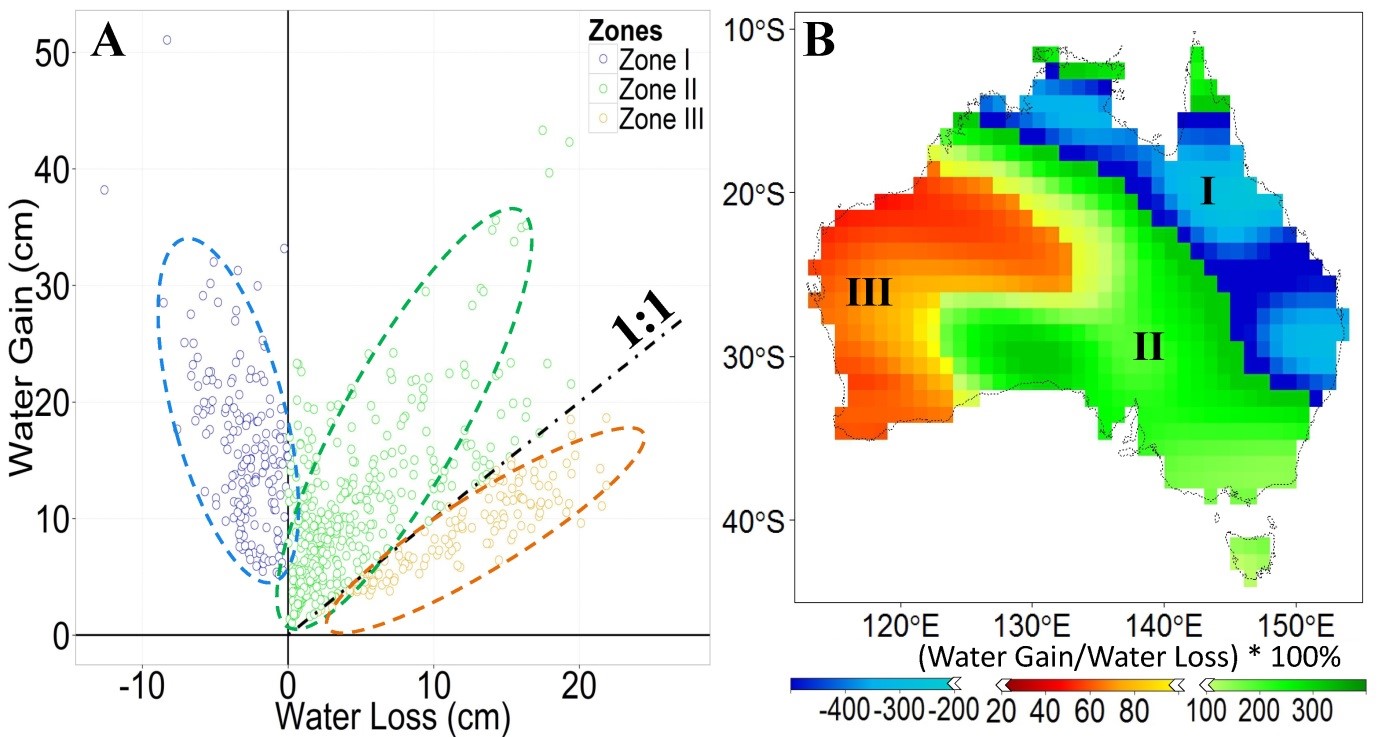
Fig. (A) Scatter plot of the water gain (cm) during the ‘big wet’ (y-axis) versus the water loss (cm) during the ‘big dry’ (x-axis) using all GRACE pixels in Australia; (B) Spatial clustering of the ratio between water gain and water loss (i.e.,TWS recovery rate) across the continent. Negative values indicate no TWS loss during the ‘big dry’. The 0-100% means water storage is partially recovered, i.e., water loss is bigger than water gain, the value of 100% means water storage is fully recovered, i.e., water gain during the ‘big wet’ equals to the water loss during the ‘big dry’. The values of >100% means the water gain is greater than the water loss.
According to the authors, this study constitutes a first attempt at using GRACE data to understand the influence of large-scale climate patterns on Australia’s water storage.
“Our findings provide insights into the control of large-scale climate patterns on Australia’s water storage which, in turn, affects the ecosystems found to significantly contribute to the global carbon and water cycles.”
Finally, the researchers note that future studies will be needed to disentangle and quantify the relative importance of each climate mode from its interactions on TWS dynamics over different geographic areas of the continent.
Reference: ‘Spatial partitioning and temporal evolution of Australia’s total water storage under extreme hydroclimatic impacts’ , Remote Sensing of Environment, doi: 10.1016/j.rse.2016.05.017