
MODIS greenness indices produce better estimates of ET and canopy conductance than LAI or FPAR
Article in press: Marta Yebra, Albert Van Dijk, Ray Leuning, Alfredo Huete, Juan Pablo Guerschman (2013) Evaluation of optical remote sensing to estimate actual evapotranspiration and canopy conductance, Remote Sensing of Environment 129: 250-261 (http://www.sciencedirect.com/science/article/pii/S0034425712004270)
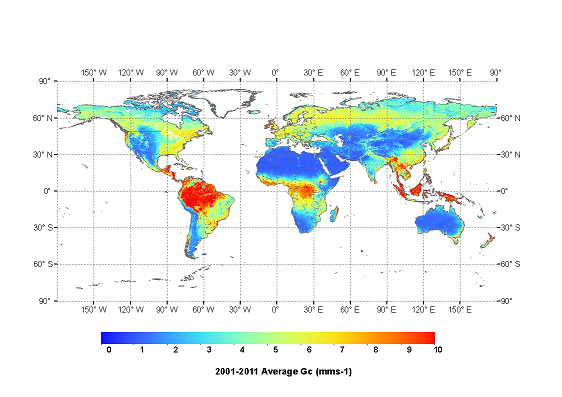
These data are available on line – see here
Abstract: We compared estimates of actual evapotranspiration (ET) produced with six different vegetation measures derived from the MODerate resolution Imaging Spectroradiometer (MODIS) and three contrasting estimation approaches using measurements from eddy covariance flux towers at 16 FLUXNET sites located over six different land cover types. The aim was to assess optimal approaches in using optical remote sensing to estimate ET. The first two approaches directly regressed various MODIS vegetation indices (VIs) and products such as leaf area index (LAI) and fraction of photosynthetically active radiation (fPAR) with ET and evaporative fraction (EF). In the third approach, the Penman–Monteith (PM) equation was inverted to obtain surface conductance (Gs), for dry plant canopies. The Gs values were then regressed against the MODIS data products and used to parameterize the PM equation for retrievals of ET. Jack-Knife cross-validation was used to evaluate the various regression models against observed ET. The PM-Gs approach provided the lowest root mean square error (RMSE), and highest determination coefficients (R2) across all sites, with an average RMSE=38Wm−2 and R2 =0.72. Direct regressions of observed ET against the VIs resulted in an average RMSE=60Wm−2 and R2 =0.22, while the EF regressions an average RMSE=42Wm−2 and R2 =0.64. The MODIS LAI and fPAR product produced the poorest estimates of ET (RMSE>44Wm−2 and R2 <0.6); while the VIs each performed best for some of the land cover types. The enhanced vegetation index (EVI) produced the best ET estimates for evergreen needleleaf forest (RMSE=28.4Wm−2, R2 =0.66). The normalized difference vegetation index (NDVI) best estimated ET in grassland (RMSE=23.8Wm−2 and R2 =0.68), cropland (RMSE=29.2Wm−2 and R2 =0.86) and woody savannas (RMSE=25.4Wm−2 and R2 =0.82), while the VI-based crop coefficient (Kc) yielded the best estimates for evergreen and deciduous broadleaf forests (RMSE=27Wm−2 and R2 =0.7 in both cases). Using the ensemble-average of ET as estimated using NDVI, EVI and Kc we computed global grids of dry canopy conductance (Gc) from which annual statistics were extracted to characterise different functional types. The resulting Gc values can be used to parameterize land surface models. We evaluated 3 approaches to estimate evapotranspiration from MODIS vegetation data. Estimation via canopy conductance (Gc) predicted flux tower data best. Greenness-related indices produced better results than LAI or FPAR products. Among the best 3 indices, none was uniformly better across land cover types. Gc estimates are provided as look-up tables and global grids for use in models.
