
Australia’s dominant role in recent sea level variability
In 2011 an anomalous drop in sea level occurred that was so strong the background trend of recent decades of +3.2 mm/yr was temporarily reversed (see Figure 1). The drop was the largest to occur since the launch of satellite radar altimeters in 1993 and accompanied one of the strongest La Nina events since 1950.
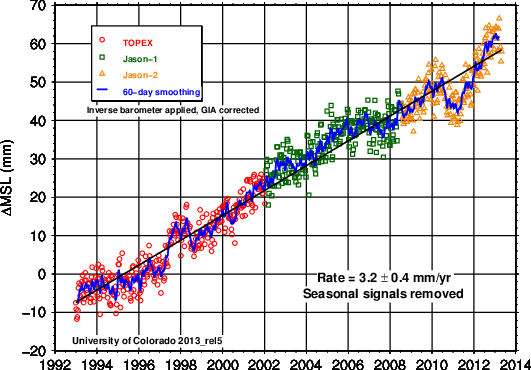
Figure 1: Global mean sea level timeseries from the University of Colorado (seasonal signal removed, Gia correction and inverse barometer applied).
The drop in sea level was a unique opportunity to address a range of compelling science questions. Throughout the era of radar altimetry, it has been recognized that sea level rise is not constant but varies considerably about the background trend, with the largest of these departures coinciding with the warm and cold phases of the El Nino / Southern Oscillation (ENSO) such as in 1997/98 (see Figure 2). However, a lack of global observations of surface mass and ocean heat content capable of resolving year to year variations with sufficient accuracy means that comprehensive diagnosis of the events early in the altimetry record (e.g. such as determining the relative roles of thermal expansion versus mass changes) has remained elusive.
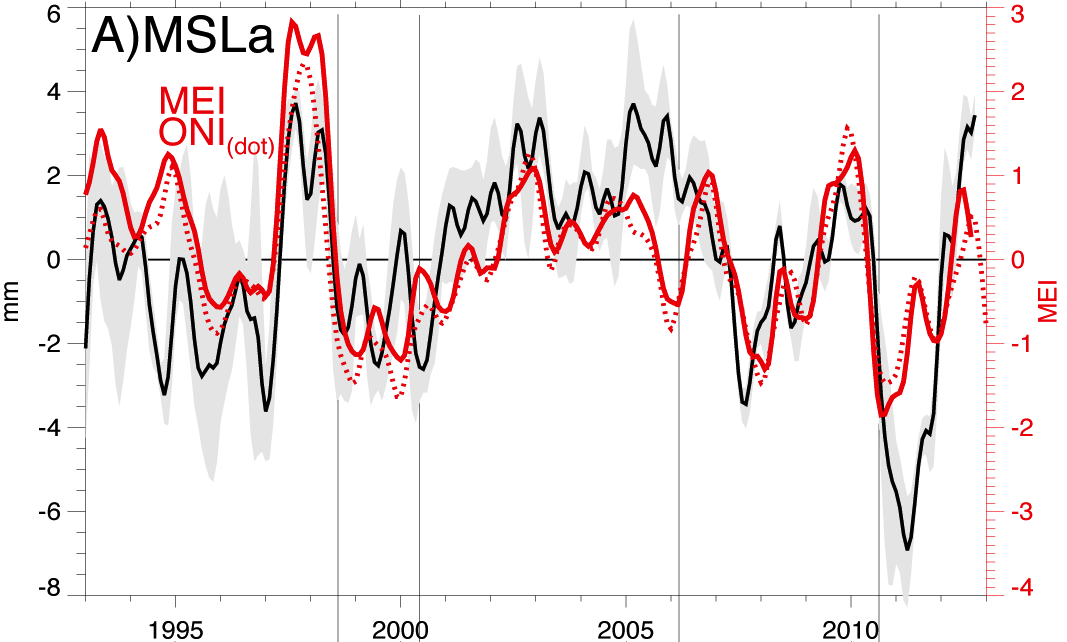
Figure 2: De-trended global mean sea level based on estimates provided of the 5 major altimetry groups with their mean (black-solid) and full range (grey shading). Metrics of ENSO based on the Multivariate ENSO Index (MEI) and Objective Niño Index (ONI) are shown in red.
With GRACE retrievals of surface mass commencing in 2002 and ARGO-derived estimates of global ocean heat content beginning a few years later, an era of unprecedented diagnostic capabilities began. In 2012, Boening et al. (2012) examined these data and found them to provide a consistent explanation of the sea level drop as a consequence of the anomalous terrestrial storage of water at low latitudes that was linked to the accompanying La Nina. Contributions to the event arising from changes in ocean heat content were shown to be negligible. While answering basic questions regarding “what” happened during the event, the study also motivated several questions regarding “why” and “how” it happened including:
- If the 2011 sea level drop was driven by La Nina, why have drops of similar magnitude not accompanied other La Nina events in the altimeter era?
- How can rainfall anomalies over land be responsible for such a prolonged drop when the runoff timescale for most land regions is a few months or so?
- Lastly, how frequently do drops similar to the one in 2011 occur and does evidence exist in the historical record for other such drops?
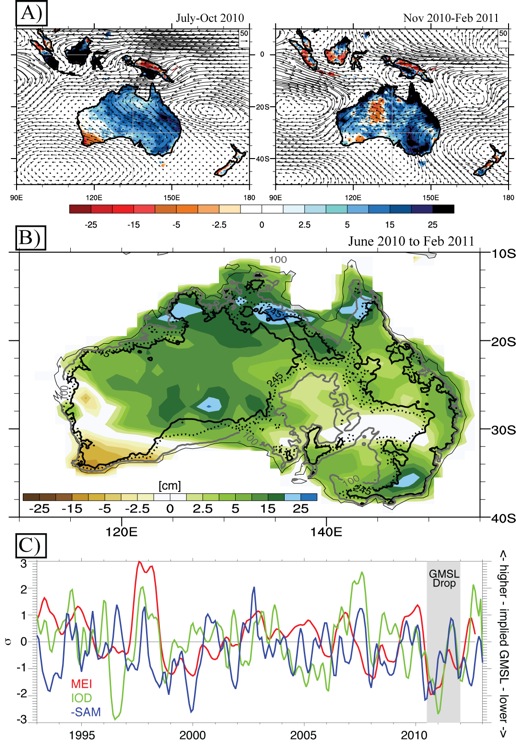
Figure 3: A) Anomalies in TRMM rainfall (colors, 0.1 mm day-1) and ERA-I water vapor transport (vectors, kg m-1 s-1) during the months of peak SAM (left) and MEI/IOD (right). B) The change in mass in Australia as reported by GRACE-CSR from June 2010 to Feb 2011. Contours represent land surface elevation isopleths (0 m, 100 m, 190 m, and 245 m) in order to emphasize the Western Plateau (west) and saddle point in northeast Australia, south of which rivers flow into the continent’s interior. C) Evolution of major modes influencing Australian rainfall.
Using surface, satellite, and reanalysis data, Fasullo et al. (2013) explore these questions and show that anomalous terrestrial storage in Australia was a dominant contributor to the global total in 2011. Moreover, a key factor distinguishing the 2011 La Nina from other recent events was the intensity and duration of flooding in Australia’s interior, a region characterized by extensive interior drainage basins in which rainfall is either stored locally at the surface before evaporating or carried by rivers towards lakes in the center of the continent rather than discharging into the ocean. These interior basins are key to the fact that only about 6% of the continent’s rainfall is discharged to the oceans by rivers (as compared to 30-40% for other continents).
Using reanalysis moisture budgets and drawing on the attribution work of others (e.g. Hendon et al., 2013), the authors demonstrate that the 2011 La Nina was also distinct from others in the altimeter era in that it coincided with a strong negative phase of the Indian Ocean Dipole (IOD) and positive phase of the Southern Annular Mode (SAM) (see Figure 3c). Together these influences drove exceptional moisture transports into the continent’s interior (see Figure 3a) and were likely responsible for one of the wettest intervals in Australia’s recorded history, the intensity and persistence of its terrestrial storage anomaly, and a considerable fraction of the global sea level response.
Extending the analysis to Australia’s surface rain gauge record over the past century suggests that only in 1973/74 has an event of similar magnitude occurred and thus similar events seem to be exceedingly rare. Moreover, there exists the potential for both internal decadal variability and climate change to modulate the severity of such events, through modulation of ocean surface temperatures in the Western Pacific Ocean and related atmospheric moisture transports into Australia’s interior. Understanding these low frequency influences remains a work in progress.
Broader implications and challenges
The 2011 drop provides a unique opportunity to both appreciate the beautifully complex and interactive nature of the climate system, and highlight the need to have a comprehensive observing system in place to understand it. The drop also presents an important opportunity to challenge climate models, as many models simulate excessive rainfall in Australia’s interior and their land surface schemes are therefore left to deal with unrealistically large associated fluxes of moisture.
To account for these biases, many land models impose artificial surface closure schemes but these are physically unrealistic and undermine direct comparison to GRACE data. The event therefore also highlights the a need to improve our models to both be able to simulate events such as the 2011 drop and to be physically realistic so as to promote evaluation with available observations.
The observing system is at risk
As climate continues to change, there is the expectation that sea level will be a vital indicator of its severity and effects, but separating the background signal from natural variability on interannual and decadal timescales (e.g. Hu and Deser, 2013) will depend critically on insights provided by a capable observing system. With the decommissioning of the Jason-1 satellite in July of this year, only the Jason-2 altimeter remains to monitor global sea level. Launched in 2008, the satellite is already well past its original 3-year design lifetime and the follow-on Jason-3 is not planned for launch until 2015.
The surface mass record is similarly at risk. GRACE’s twin satellite constellation has already lived well past its original 5-year mission duration and battery problems now require the satellites to be shut down for about two months per year, resulting in gaps in its record that are expected to grow over time as its batteries continue to degrade. The GRACE follow-on mission is not planned to launch until 2017. Lacking these crucial data, both our understanding of climate variability and change, and our informed stewardship of this wondrous planet, can only suffer.
References:
- Boening, C., Willis, J. K., Landerer, F. W., Nerem, R. S., & Fasullo, J. (2012). The 2011 La Niña: So strong, the oceans fell. Geophysical Research Letters, 39(19).
- Fasullo, J.T., C. Boening, F.W. Landerer, & R.S. Nerem (2013), ‘Australia’s unique influence on global sea level in 2010–2011’, Geophysical Research Letters, DOI: 10.1002/grl.50834.
- Hendon, Harry H., et al. “Causes and predictability of the record wet east Australian spring 2010.” Climate Dynamics (2013): 1-20.
- Hu, A., & Deser, C. (2013). Uncertainty in future regional sea level rise due to internal climate variability. Geophysical Research Letters.
Dr. John T. Fasullo (fasullo@ucar.edu ) is a Project Scientist at the National Center for Atmospheric Research and a Research Associate at the University of Colorado.