
Smile, forests, you’re on camera
TERN, together with fellow NCRIS project the Australian Plant Phenomics Facility (APPF), have installed time-lapse cameras at TERNSuperSites around Australia to monitor the timing of vegetation development, including flowering, fruiting, and leaf lifecycle—known as phenology.
This nation-wide network of cameras forms part of a larger network called the Australian Phenocam Network, which collects repeat digital photographic images of vegetation that help scientists to monitor the direction and magnitude of changes to vegetation phenology due to climate change and extreme weather events, such as cyclones and droughts.
Together, the TERN SuperSites Bioimage Portal and the Australian Phenocam Network are making huge amounts of time-lapse image data accessible for scientists studying seasonal vegetation changes and carbon dynamics. One such scientist is Dr Tim Brown, a research fellow with the ANU Australian Research Council (ARC) Centre of Excellence in Plant Energy Biology.
Tim, who helped TERN launch the Australian Phenocam Network after collaborating with similar networks in North America and Europe, is using the data from the network to build virtual versions of forests that hold the “personal data and history of every tree”.

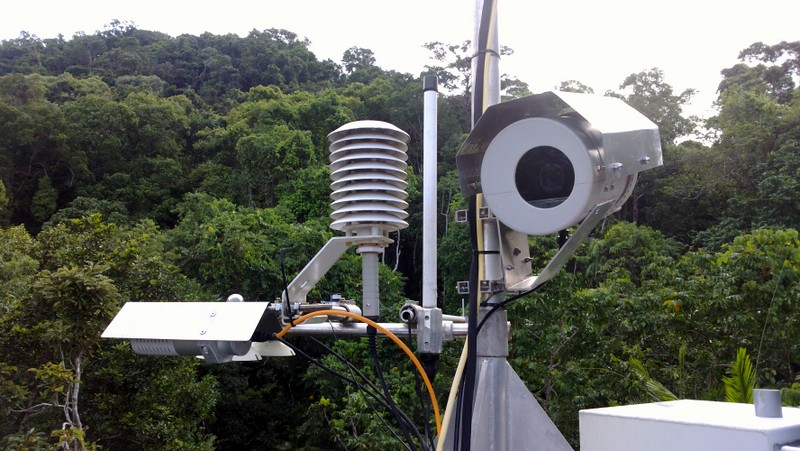
TERN’s national vegetation surveillance infrastructure, inclduing the above ‘phenocam’ installed at TERN’s FNQ Rainforest SuperSite, and data it delivers are helping researchers monitor vegetation and better understand how climate change will affect ecosystems around the world.
“It’s a bit like star trek. Researchers walking through a forest could use a tablet or augmented reality to view sensor data layered onto the actual trees,” says Tim. “This complexity of data is needed to crack really serious environmental issues. However, until recently it was hard to use these new technologies well unless you were a total geek. You get a huge pile of data that can be really hard to make sense of,” he says.
Tim is harnessing gaming technology to organise the huge quantities of data that are produced by surveillance cameras and other sensors into easily accessible formats.
Footage from a TERN supported PhenoCam at the TERN OzFlux Howard Springs ecosystem monitoring site in the Northern Territory showing seasonal vegetation greening then senescence (video courtesy of Caitlin Moore) (TERN Howard Springs PhenoCam Seasonal Veg Change from TERN Australia on Vimeo.)
Another scientist utilising TERN’s national phenocam infrastructure is Monash University PhD student Caitlin Moore. Caitlin has recently co-authored a synthesis paper published in Biogeosciences Discussions and part of the recent TERN OzFlux special issue, which highlights the value of phenocams for monitoring vegetation phenology in Australian ecosystems.
“Phenocams enabled us to pick up on smaller scale phenology changes otherwise missed by the larger scale remote sensing approach,” says Caitlin.
“Whilst remote sensing provides a useful tool for characterising broad phenological diversity over the continent of Australia, phenocams provide a more detailed insight into site-specific changes that are not captured by remote sensing indices.”
“For example, phenocams were able to capture individual tree canopy defoliation and flushing events in the Daintree rainforest, which is otherwise regarded as consistently evergreen.”
In addition to the synthesis paper, Caitlin’s PhD work is using PhenoCams alongside an array of state of the art sensors, including overstory and understory vegetation spectrometers and the TERN OzFlux tower systems to collect data on energy transfers, light radiation, and physical vegetation changes.
TERN infrastructure has enabled Caitlin to tease apart tree [overstory] and grass [understory] productivity dynamics in an Australian tropical savanna, providing an important insight into their relative variability over time.
Caitlin has used phenocams installed at TERN’s Howard Springs site in the Northern Territory to explore the links between tree-grass productivity and phenology. Using phenocams Caitlin was able to identify species-level changes in phenology, as well as track changes in gross primary productivity (GPP) of the trees and grass. Her results were also used to improve models of GPP, including those developed by TERN eMAST.
Caitlin says that this information is very useful for improving our current understanding of carbon uptake from savanna ecosystems—covering approximately 20% of the Earth’s land area—and will assist policy makers and managers to sustainably manage Australian savannas into the future.
Caitlin’s work is an excellent showcase of how the multiple facilities of TERN can be collaboratively used, in this case by integrating the infrastructure provided by TERN’s Australian SuperSite Network, TERN OzFlux data, TERN AusCover remote sensing imagery, and TERN eMAST models.

- Click here for more information on TERN’s PhenoCam network
- An example of Dr Brown’s work, a panorama of North Canberra taken from Black Mountain, showing the contrast between spring and autumn colours was selected as the cover for the March 2016 issue of the Journal Frontiers in Ecology, in which his research is published. An interactive version of the Canberra Panorama is here.
- Caitlin’s PhD work is supervised by Jason Beringer (University of Western Australia), Bradley Evans (Macquarie University), Lindsay Hutley (Charles Darwin University) and Nigel Tapper (Monash University) and relies heavily on the infrastructure provided by TERN. Caitlin’s has submitted multiple papers showcasing her work using TERN’s phenocam network to the Biogeosciences journal. They are currently featured in the TERN OzFlux special issue.

TERN and it’s partners have installed state-of-the-art dome-shaped Stardot phenocams (above) on the TERN OzFlux tower at the Daintree node of the FNQ Rainforest Supersite. These phenocams are the same type as used by TERN’s USA partner networks NEON and the American Phenocam Network.
Original article published in TERN newsletter July 2016