The sensitivity of atmospheric river identification

If you’ve ever logged on to a website or bought something online, you’ve probably had to do a reCAPTCHA to prove you’re human. reCAPTCHAs are photos of everyday scenes where you have to select all the squares that contain a particular object like a car or traffic light. Humans are good at differentiating between ambiguous images. Robots and computers suck at it.
Try defining a bus using only statements with a yes/no answer:
- Is it longer than 2m and shorter than 20m?
- Does it transport between 1 and 100 people?
- Is it on a road?
- Does it have 4-8 wheels?
That description fits a bus, but it also describes a van, a large SUV, and a truck. We could restrict it further, for example, by changing the definition to a ‘bus’ to be something longer than 5m and shorter than 20m, but that would then exclude minibuses. Do we even want to include minibuses? These are the sorts of challenges scientists face when creating a computer program to identify weather systems in tens of thousands of images in order to understand trends and relationships between the weather and its impacts.
Atmospheric Rivers (ARs) are large corridors of increased water vapour flow in the lower atmosphere. ARs can cause hazards such as heavy rainfall, damaging winds, landslides and flash flooding. Recently, there has been a lot of discussion about how scientists should define these weather phenomena, for example, what is the minimum amount of water vapour needed for a weather system to be considered an AR. As a result, there has been a large variety of different algorithms developed to identify ARs. These previous studies have used a variety of datasets and resolutions to identify ARs.
Unsurprisingly, different methods and datasets lead to slightly different results. Of the 30+ methods, how do we know which ones to trust? And what dataset and resolution should we use for future studies? This study by Kimberley Reid, Andrew King, Todd Lane and Ewan Short explores the sensitivity of Atmospheric River identification to the input dataset and water vapour transport thresholds used to define Atmospheric Rivers. We used a single identification algorithm and varied the resolution, threshold and regridding method of the input integrated water vapour transport (IVT) field. Here, IVT is defined as:
In this equation:
- g is acceleration due to gravity,
- q is specific humidity,
- u and v are the horizontal wind components in the zonal and meridional direction, respectively, and
- p is the pressure difference of 100hPa as IVT was calculated at 100hPa vertical increments between 1000hPa and 300hPa.

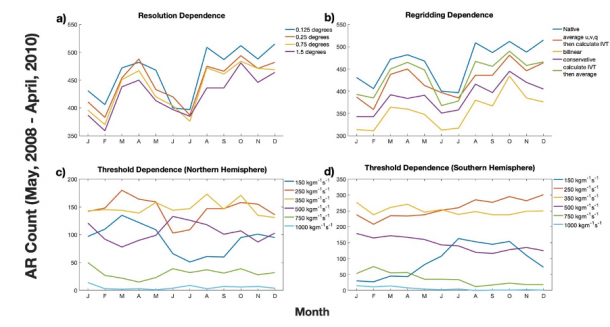
Global AR count for each month over Years of Tropical Convection period. Lines indicate different a) IVT input resolutions, b) regridding methods of IVT field from native to coarse resolution (1.5°x1.5°), and identification scheme thresholds in the c) Northern Hemisphere and d) Southern Hemisphere. A threshold of 250kgm-1s-1 was used for a) and b). Source: Reid et al., 2020.
We found that as we coarsened the IVT field, the number of ARs identified decreased. However, how we coarsened the field mattered too. Coarsening the resolution using a bilinear interpolation scheme led to much fewer ARs being identified than using a conservative scheme or simply averaging. Additionally, the order of operations was important. If we calculated IVT then coarsened the resolution, a different number of ARs were identified from the input data than if we coarsened the resolution and then calculated IVT.
AR identification is highly sensitive to the choice of IVT threshold, importantly, the commonly used 250 kg m‐1 s‐1 IVT threshold is not appropriate for global studies with detection methods that also include a restrictive geometric condition as this combination can lead to the strongest systems failing to be identified. The uncertainties within a single AR detection method and input data parameters may be as large as uncertainties across AR detection methodologies.
Originally published by the ARC Centre of Excellence for Climate Extremes, 20 October 2020.


