
WaterSENSE: On-farm reservoir volume modelling by combining remote sensing and Bayesian statistics
Accurate water accounting is an important tool to manage our precious water resources in the dry Australian climate. Understanding the volumes of water extracted and stored in farm dams can assist with on-farm and catchment management. The WaterSENSE project focuses on developing a range of tools to manage the water value chain in Australia, mostly based on Copernicus satellite data. The University of Sydney is part of a consortium in this project with several European and Australian partners: eLEAF, HCP International, Hidromod, Hydro & Meteo GmbH, Hydrologic Research, and Water Technology.

On-farm dam monitoring was developed as a two-step procedure. In the first step, active on-farm dams are automatically delineated, using surface reflectance data from Sentinel 2 satellites, by creating a water occurrence map and limiting this to farm dam sizes and only targeting dams that are at least full 20% of the time.
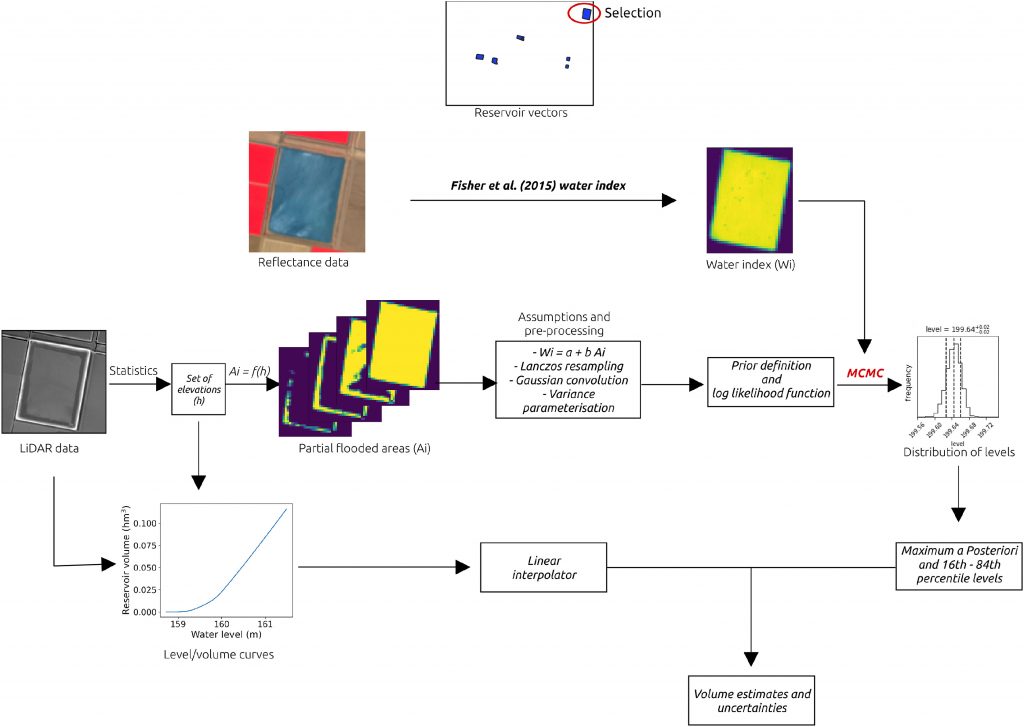
To quantify the uncertainty in the analysis, the second step applies a Markov Chain Monte Carlo (MCMC) method using the active on-farm dams from step 1. MCMC method assumes a linear relationship between partial flooded areas and water index rasters obtained from Sentinel 2 satellite scenes. Partially flooded area rasters can be derived using LiDAR data through a sequence of elevations within the reservoir. This created sequences of flooded masks and level-volume curves for farm dams.
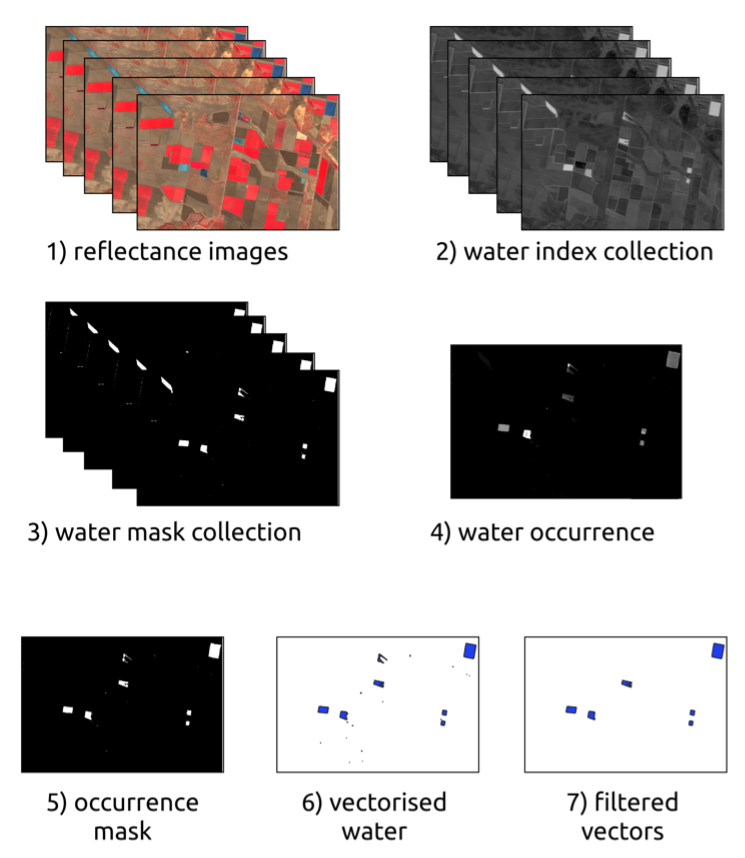
Automated reservoir detection steps
The MCMC sampling gave posterior distributions of the level estimation and therefore an uncertainty range. These can be transformed to volumes by using a linear interpolation of the level-volume curves. The approach led to accurate predictions in the Keepit and Pamamaroo (Menindee) lakes. Vegetation in the reservoirs degrades the performance of the methodology, so there is still more work to do. Our future work aims to verify the predictions in smaller reservoirs and being able to link this to whole farm water use and efficiency.
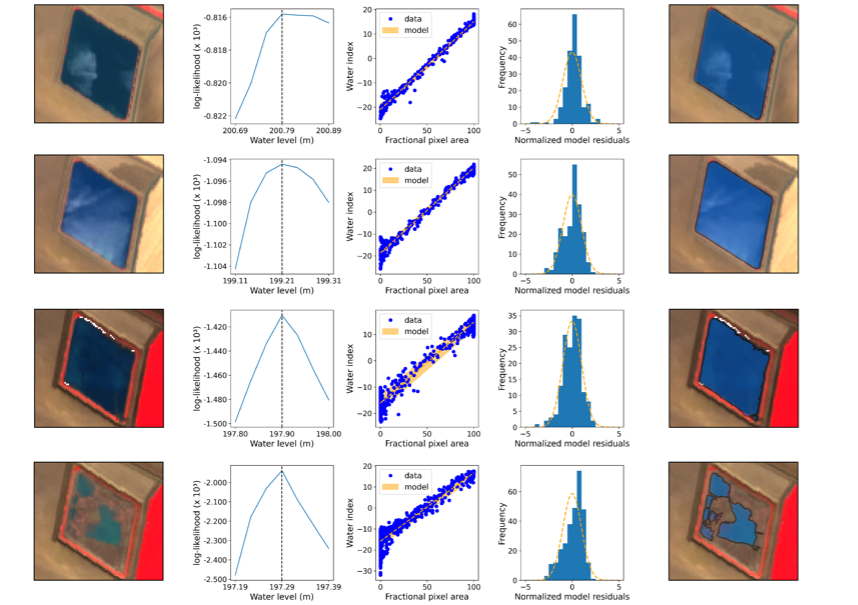
Water reservoir level estimations at different dates. The Left panel shows false colour satellite images, while the right panel shows the water vectors associated to the water level estimated. The middle panels present from left to right: i) the change in the log-likelihood depending on the water levels and the level associated with the maximum log-likelihood (dashed vertical line); ii) scatter plots of fractional pixel areas as percentage and the water index, and the model applied; and iii) histograms of the normalised model residuals (z-scores/pulls)