
Assessing our water resources
With many pressures on water resources around Australia, it’s important to take stock and assess water availability and use across the country.
Water in Australia 2013–14 is our first assessment report to provide a national overview of climatic conditions, hydrology, how much water is available, and how it is used.
Key findings from the 2013–14 report include:
- Rainfall patterns differed significantly across the country—with less than average rainfall in the east and far west, and more than average in the north and eastern Western Australia. Wetter conditions were mostly driven by exceptional events or series of events, rather than regular seasonal rains.
- Surface water storages were 63 per cent full at 30 June 2014.
- Water levels were close to average in the majority of groundwater bores analysed around the country.
- The drought in southern Queensland and northern New South Wales, which started in 2012, continued in 2013–14. However, the impacts were not yet reflected in Queensland’s groundwater levels due to the system’s slow response to extractions and reduced recharge.
- Desalination plants can supply 630 GL of purified sea water per year*and the total effluent treatment capacity of recycling plants is 940 GL.
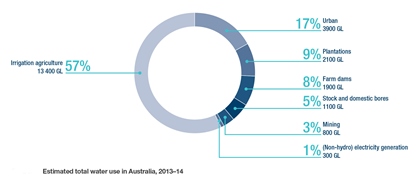
- An estimated 23 500 GL of water was used across Australia was in 2013–14, with the top two water uses being irrigation (57%) and urban consumption (17%)**.
- Environmental water holders in the Murray–Darling Basin held 3192 GL of surface water entitlements at the end of 2013–14 (increasing from 3160 GL at the end of 2012–13).
- Water trading continued to facilitate the buying and selling of water rights, allowing water to be moved and put to more effective use. Entitlement trade increased to 2400 GL and allocation trade reduced slightly to around 5500 GL.
- Urban water use was estimated to be 3900 GL. Use in the major cities showed no significant changes with Sydney, Melbourne and South East Queensland recording only slight increases since 2011–12.

Water in Australia takes over the role of the biennial Australian Water Resources Assessment (2010 and 2012) and the annual National Water Account summary (2012 and 2013) to provide a comprehensive overview of Australia’s water situation for an assessment year (1 July – 30 June).
The report provides a narrative of the water situation in the reporting year illustrated by significant events from across Australia. It is complemented by two products:
- Regional water information, which provides spatial information, down to river region level, on the status of water resources and use during the assessment year
- Monthly water update, which provides a regular snapshot of rainfall and streamflow for the previous month relative to average conditions.
Check out Water in Australia 2013–14
Article originally posted on enGauge (BOM) website, December 2015 (Link)