
Capturing the life cycle of drought for better drought preparedness

Current Australian drought policy aims to promote preparedness and resilience in favour of costly disaster-relief based strategies. Recent conditions have highlighted a shortfall in this approach, with Federal Government aid contributions exceeding $1 billion near the end of 2018. The challenge lies in the difficulty of predicting drought and understanding how droughts initiate, propagate through a catchment and terminate. Our research article, currently under review, addressed this issue for an area in the Upper Hunter of NSW which has the advantage of a unique set of historical instrumental data.
The first step of the study was to generate a 107-year drought record using the six-monthly Standard Precipitation (SPI6 for meteorological droughts) and Surface Water Supply Indices (SWSI6 for hydrological droughts). A drought was six consecutive months of index values below -1. A drought ended when there were six consecutive months of index values above -1. We identified 13 meteorological droughts that, on average, lasted 10 months. Only 8 hydrological droughts occurred over the same period, as they only followed long meteorological droughts. These lasted an average of 12 months. Both types of droughts manifested slowly and were a result of the combined effect of the Indian Ocean Dipole and El Niño. They terminated, however, within the space of a month and were caused by synoptic scale events such as monsoonal troughs and East Coast lows.
The second stage of the study aimed to identify how rainfall deficits propagate through the drought cycle, in relation to soil moisture and vegetation stress and recovery. Agricultural drought occurs when decreased rainfall starts affecting vegetation growth, soil moisture and agricultural productivity. Remote sensed vegetation data and field measured soil moisture data were found to be well correlated with the drought indices (r = 0.56 and 0.58). As a result, they declined during drought but also showed strong recovery following termination. The study area recovered more quickly from drought than areas west of the Great Dividing Range, and rainfall deficits were less severe. This shows that not all areas are created equal in their ability to withstand and recover form drought and this needs to be accounted for in policy.
The Federal Government is currently proposing a $3.9 billion “drought proofing” fund for projects to increase drought preparedness and resilience in agriculture. We’ve shown that the issue of drought needs information developed on the whole life cycle of drought at the local scale. The flow chart shown outlines how drought, from onset to propagation and termination, can be better measured. By understanding this, we can then be better prepared for it and make better decisions during drought; reducing the cost of this natural hazard.
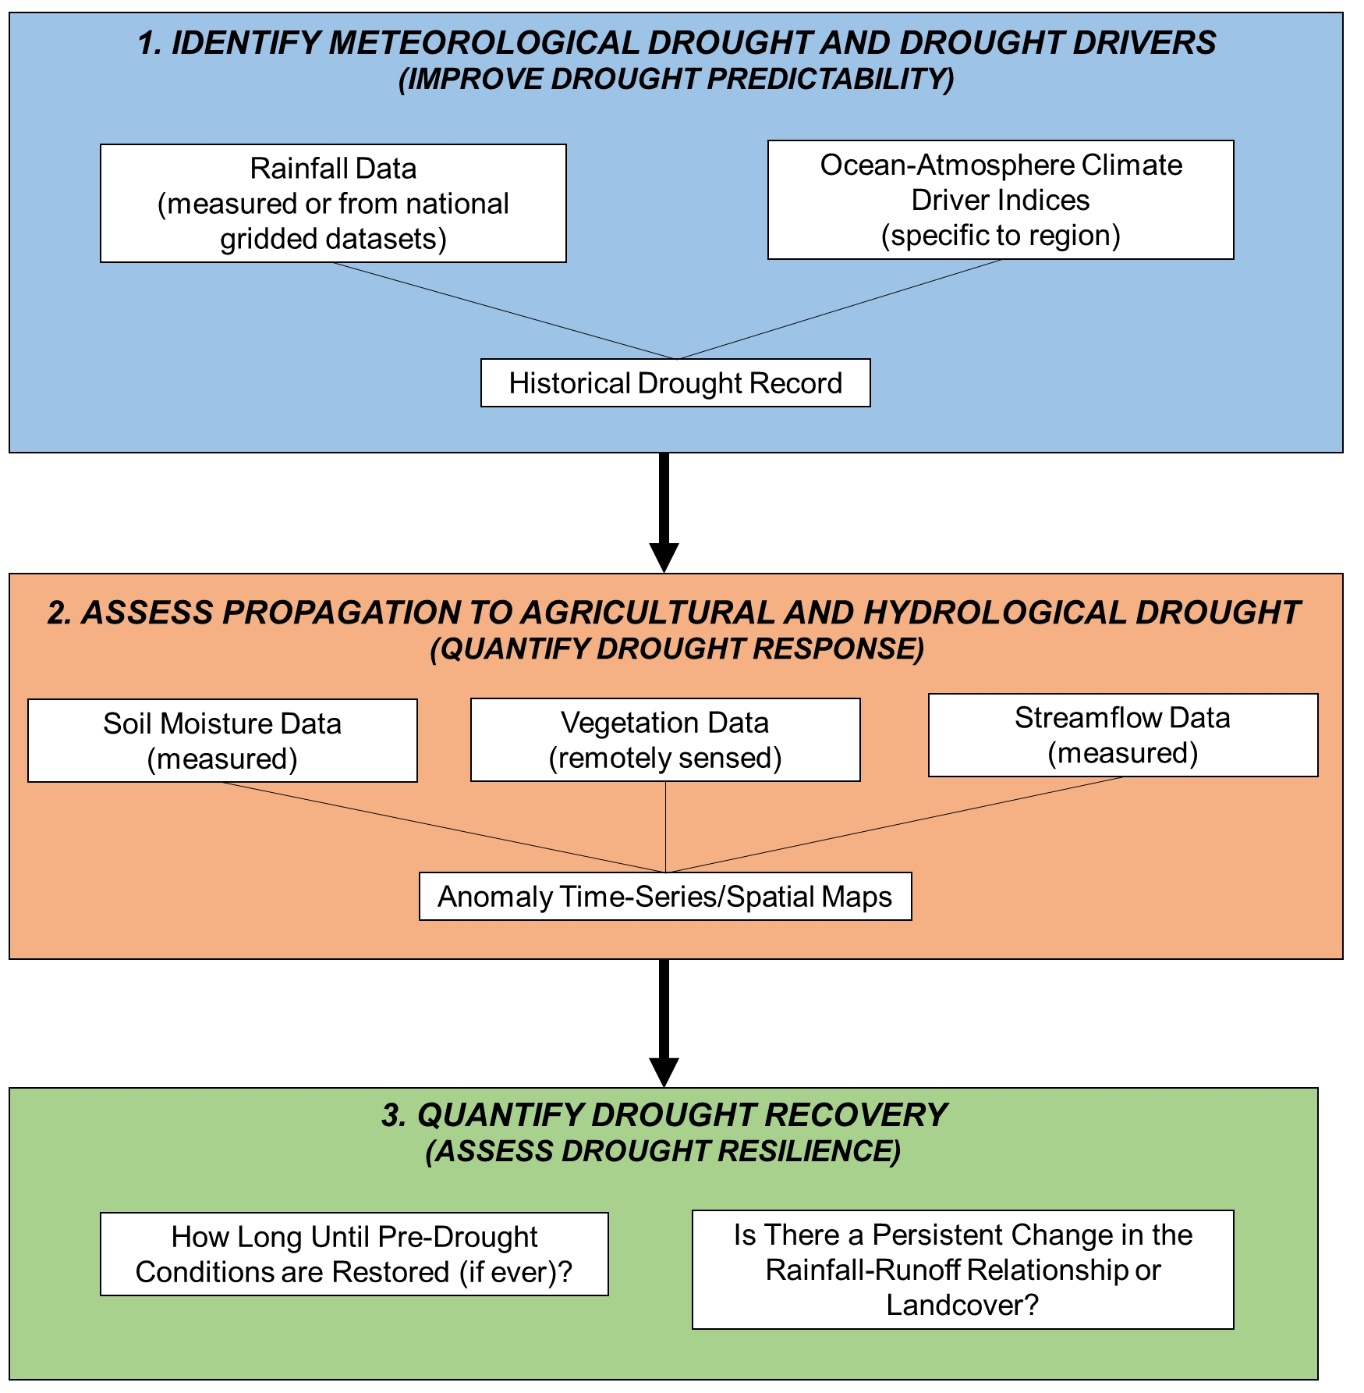
Conceptual diagram of how the entire drought life cycle can be measured (see Gibson et al. (2019) for details).
The study utilised the Scaling and Assimilation of Soil Moisture And Streamflow (SASMAS) data. More information on the climate and soil variables available can be obtained from the authors and at https://www-eng.newcastle.edu.au/sasmas/SASMAS/sasdata.html.
Paper: Gibson, A. J., Verdon-Kidd, D. C., Hancock, G. R., and Willgoose, G.: Catchment-scale drought: capturing the whole drought cycle using multiple indicators, Hydrol. Earth Syst. Sci. Discuss., https://doi.org/10.5194/hess-2019-311, in review, 2019.