
One-sixth of global river flows evaporate before reaching the sea – but only 1% by irrigation
Less than 1% of global river flows is used for irrigation, and only 1% of that occurs in Australia. That is the result of a high-resolution global model-data analysis we published recently.
The importance of evaporation from wetlands, lakes and irrigation areas in the global water cycle and climate system is poorly understood. So far, estimating these so-called secondary evaporative losses has only been possible for small regions, where their impact can be considerable.
Our goal was to develop a model capable of tracking all of the water on the Earth’s land surface, measuring the quantity of water present in rivers and catchments. We developed a solution that can be applied at a very high resolution globally by making use of satellite observations. Being able to run this detailed model at a global scale relied on the combined computational performance and highly optimised data collections at the National Computational Infrastructure (NCI).
We developed a methodology to assimilate satellite-derived information into the landscape hydrological model W3, a model that has much in common with the Bureau of Meteorology’s AWRA-L model. We applied the model at the same 0.05° (ca. 5km) resolution as AWRA-L, but at the global scale.
Features such as rivers, lakes, wetlands and irrigation areas are difficult to accurately model, in large part because of the way they change dynamically over the course of days to years. The main innovation of this model is the incorporation of additional satellite data into the model. We assimilated satellite observations from the MODIS satellite instrument, including surface water extent, surface albedo, vegetation cover, leaf area index, canopy conductance and land surface temperature. Evaluation against river basin discharge records showed the model produced much more reliable estimates of water use from wetlands and irrigation than anything previously possible.
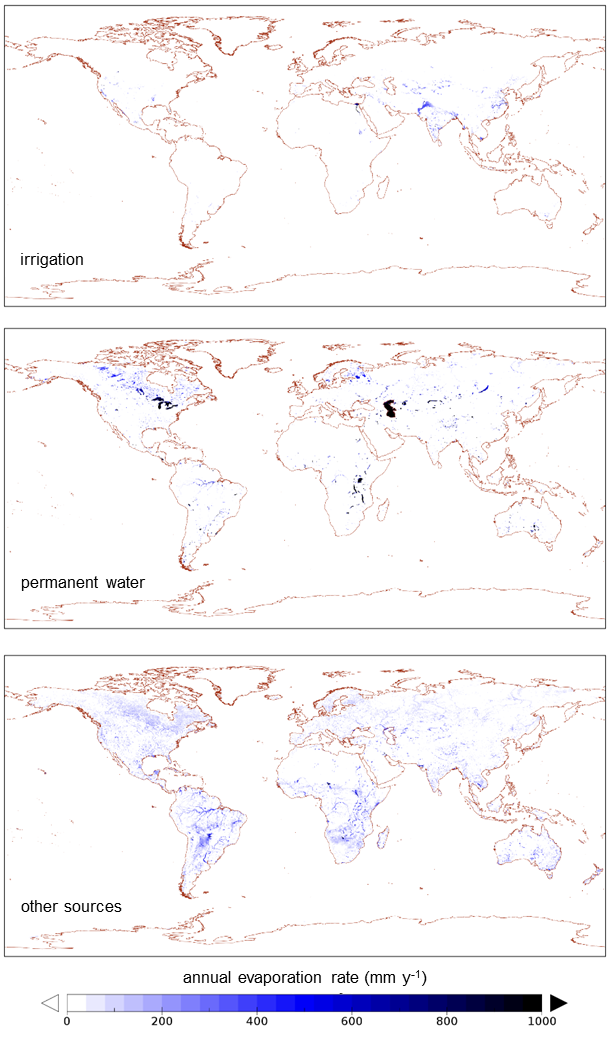
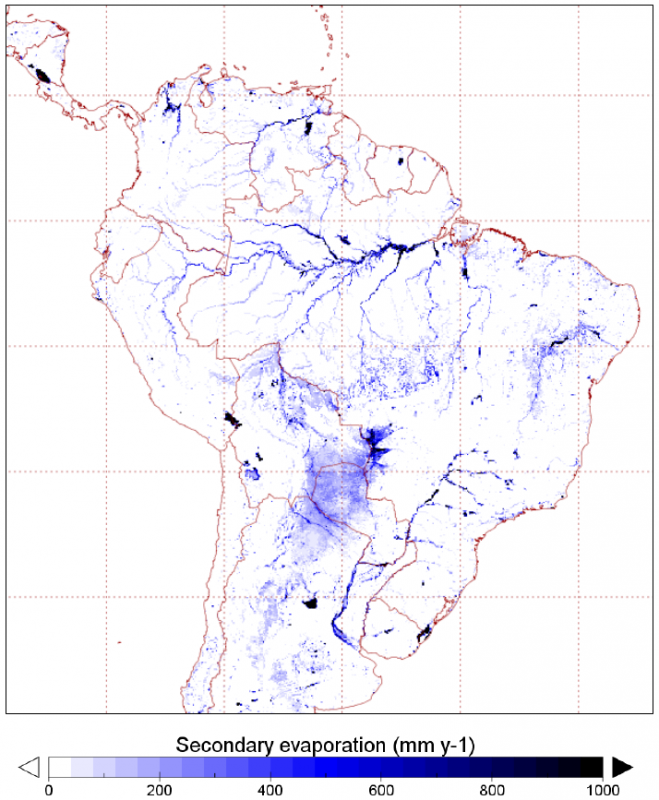
Global maps of secondary evaporation from different sources. (Source: Van Dijk et al., 2018)
The result can be considered a global hydrological reanalysis, an optimal combination of observations and modelling not unlike the way Numerical Weather Prediction models are used to produce atmospheric reanalysis. Water managers around the world may find the data useful to better understand their water resources and support management decisions.
We estimate that 16% of global river flows evaporate before reaching the sea, increasing total terrestrial evaporation by almost 9%. Of this volume, only 5% evaporated from irrigation areas. The rest evaporated from permanent water bodies such as lakes and rivers (58%) and flood-prone surfaces such as wetlands and floodplains (37%).
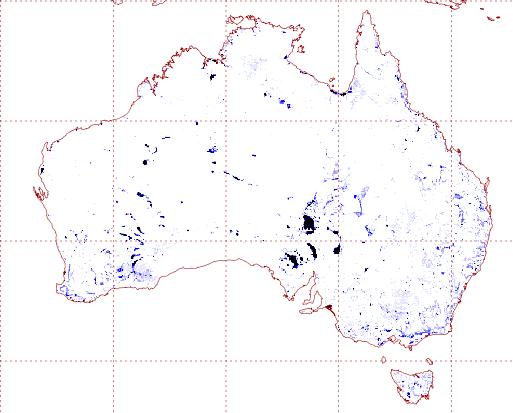
Secondary evaporation sources in Australia. (Source: Van Dijk et al., 2018)
Irrigation water use represents only 1% of total river flows. Australia is ranked 35th in terms of global irrigation water use, responsible for only 1% of that 1%. Despite being insignificant in global terms, Australia’s irrigation water use has a profound effect on many of our rivers and wetlands. For example it accounts for around half of total river flows in the Murray-Darling Basin. Clearly, changes that are small in global terms have a much bigger impact locally. That further illustrates the need for modelling and measurement methods with fine spatial detail.
Reference:
Van Dijk, A. I. J. M., Schellekens, J., Yebra, M., Beck, H. E., Renzullo, L. J., Weerts, A., and Donchyts, G. (2018). Global 5 km resolution estimates of secondary evaporation including irrigation through satellite data assimilation, Hydrol. Earth Syst. Sci., 22, 4959-4980, https://doi.org/10.5194/hess-22-4959-2018, 2018.