
Understanding trends in water availability across Australia with AWRA-L
Climate change has far reaching implications on the hydrologic cycle impacting agricultural productivity, water resources availability, and increasing flood hazard – but understanding how the hydrologic cycle is changing across Australia is challenging. Many hydrometeorological variables are not measured, and when they are it is limited areas with short record lengths making a holistic understanding of how climate change is affecting Australia’s hydrologic cycle difficult.
Here we take a different approach – rather than using observations – we use The Australian Water Resource Assessment -Landscape model (AWRA-L) to investigate how hydrometeorological variables (and their interactions) are changing across Australia. AWRA-L has the advantage of a continental coverage, which includes ungauged basins, allowing us to take a detailed look at rainfall, evapotranspiration, soil moisture, and streamflow (runoff) in unison across the continent of Australia.
What is AWRA-L?
AWRA-L is a daily, ~5km x 5km gridded, one-dimensional, semi-distributed continental-scale landscape water balance model, run operationally by the Australian Bureau of Meteorology. It is continually being improved and updated with its performance evaluated against catchment streamflow, remotely sensed soil moisture, evapotranspiration, as well as in-situ measurements of soil moisture, evapotranspiration, and groundwater recharge.
AWRA-L has many practical applications including estimating antecedent conditions for flood forecasting, informing inputs for design flood estimation, understanding the impacts of changes in soil moisture on flood seasonality, and identifying flash droughts. As we are interested in trends in hydrometeorological variables we further evaluated the observed trends in 160 catchments across Australia, and compared them to those simulated by AWRA-L. The annual streamflow trend direction was replicated at 76% of locations with this increasing to 88% for winter. In fact, in south-east Australia, the primary agricultural region of Australia, a 100% correspondence was found between modelled and simulated trend direction.
How are hydroclimatic variables trending across Australia?
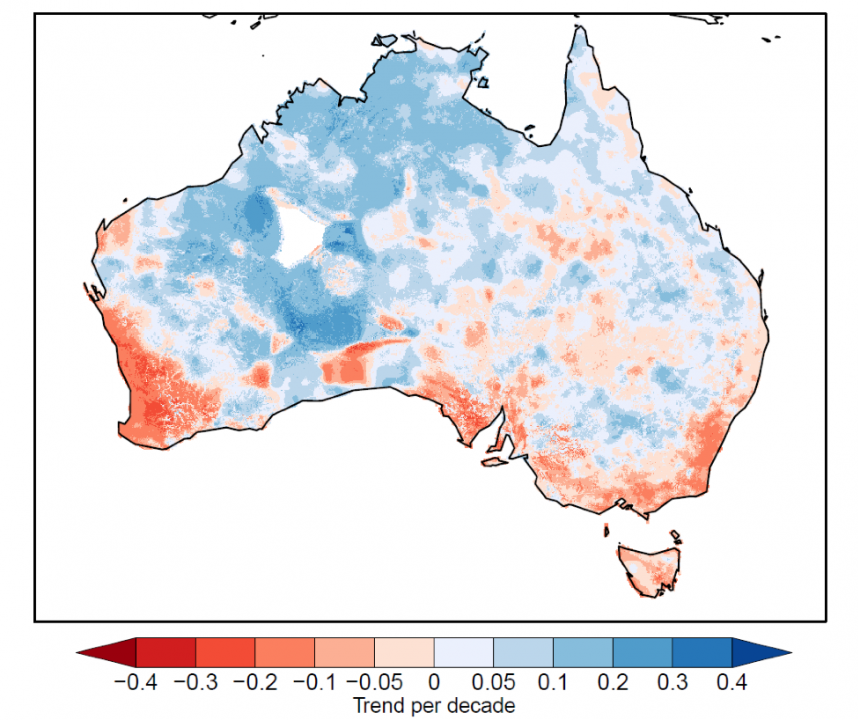
Conistent with a tropical expansion, since 1960 there has been a trend to wetter conditions in the monsoon-dominated summer months in the north and a trend towards drier conditions in the south in the winter months. Trends in evapotranspiration, soil moisture, and runoff have followed trends in rainfall with little correspondence to trends in potential evapotranspiration confirming Australia as a moisture limited environment.
Overall, rainfall changes are driving changes in streamflow. Soil moisture is a secondary driver except in the dry season where changes in soil moisture and rainfall are equally related to streamflow changes. Trends in the 90th percentile of runoff are also largely related to changes in mean rainfall. Decreases in these high flows (an indicator of flood risk) are greatest in the south-west and south-east coastal regions of Australia. But for more severe flow extremes, such as the 5-day annual maximum flow, there are less negative trends suggesting the more extreme the flow event, the more likely it is to be increasing, in line with increases in extreme rainfall.
Using the standardised runoff index as an indicator of drought, a shift to more frequent (and widespread) drought across large parts of Australia was found. The greatest shifts to more frequent drought conditions were found in the south-east and south-west of Australia, with evidence that parts of the tropics will also experience increasing drought, despite increases in rainfall. This is consistent with decreases in both mean and high flow runoff events driven by decreases in antecedent soil moisture.

What does this mean for future water availability?
Across Australia we have already seen increasing droughts affecting agriculture and water supply. We found trends towards greater rainfalls and water availability in the tropics with declines in rainfall and water availability in the south of the continent. But even with these increases in mean rainfall in the tropics, there are still part of the tropics where drought is likely to increase due to changes in the pattern of rainfall, consistent with projected decreasing water availability in these regions. If these trends are to continue, we can expect the water shortages we are already experiencing to be further exacerbated.
Reference:
Wasko, C., Shao, Y., Vogel, E., Wilson, L., Wang, Q.J., Frost, A., Donnelly, C., 2021. Understanding trends in hydrologic extremes across Australia. J. Hydrol. 593, 125877. https://doi.org/10.1016/j.jhydrol.2020.125877